

Data can be too much sometimes. Even if it is visually plotted for you. It’s easier to understand but not really easy to analyze.
So, in this blog, we are going to explore the feature of the summary card that most of the Dynamics map integration tools are equipped with.
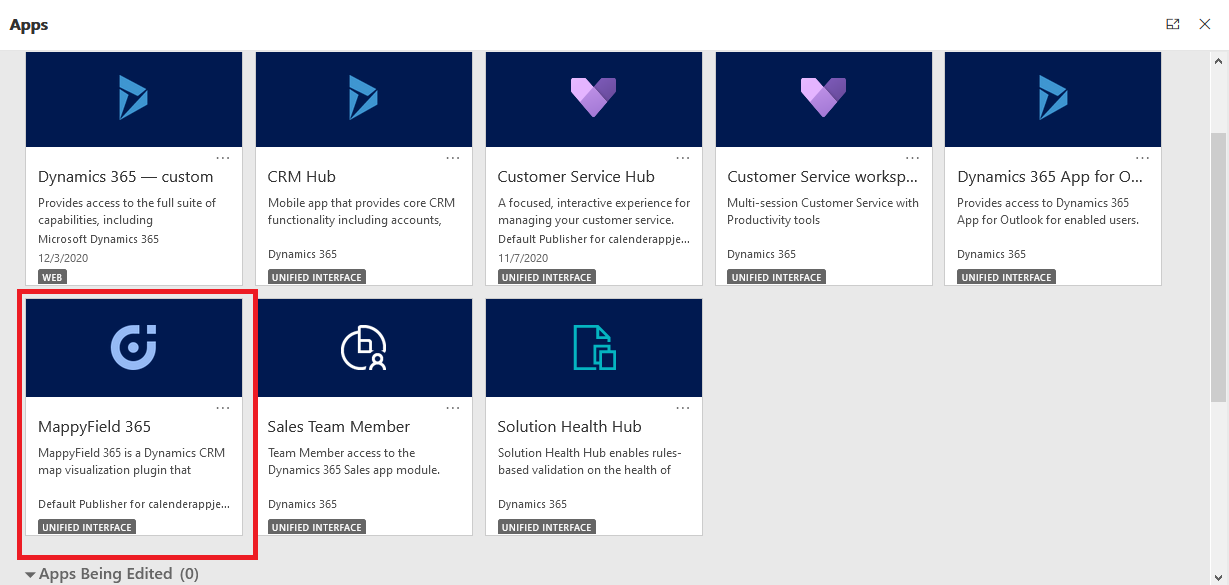
For the demonstration purpose, we are going to take MappyField 365.
What is Summary Card Feature?
The Summary Card feature allows users to get detailed and summarized information of the plotted data on the map like potential revenue, net value, etc. By getting aggregated information, users can quickly analyze and devise their strategy for a particular region!
Here’s how you can configure and access the summary card feature:
– Configure the Summary Card details from ‘Entity Mappings’
– Plot the records on the map
– Click on the ‘Summary Card’ from the Advanced options
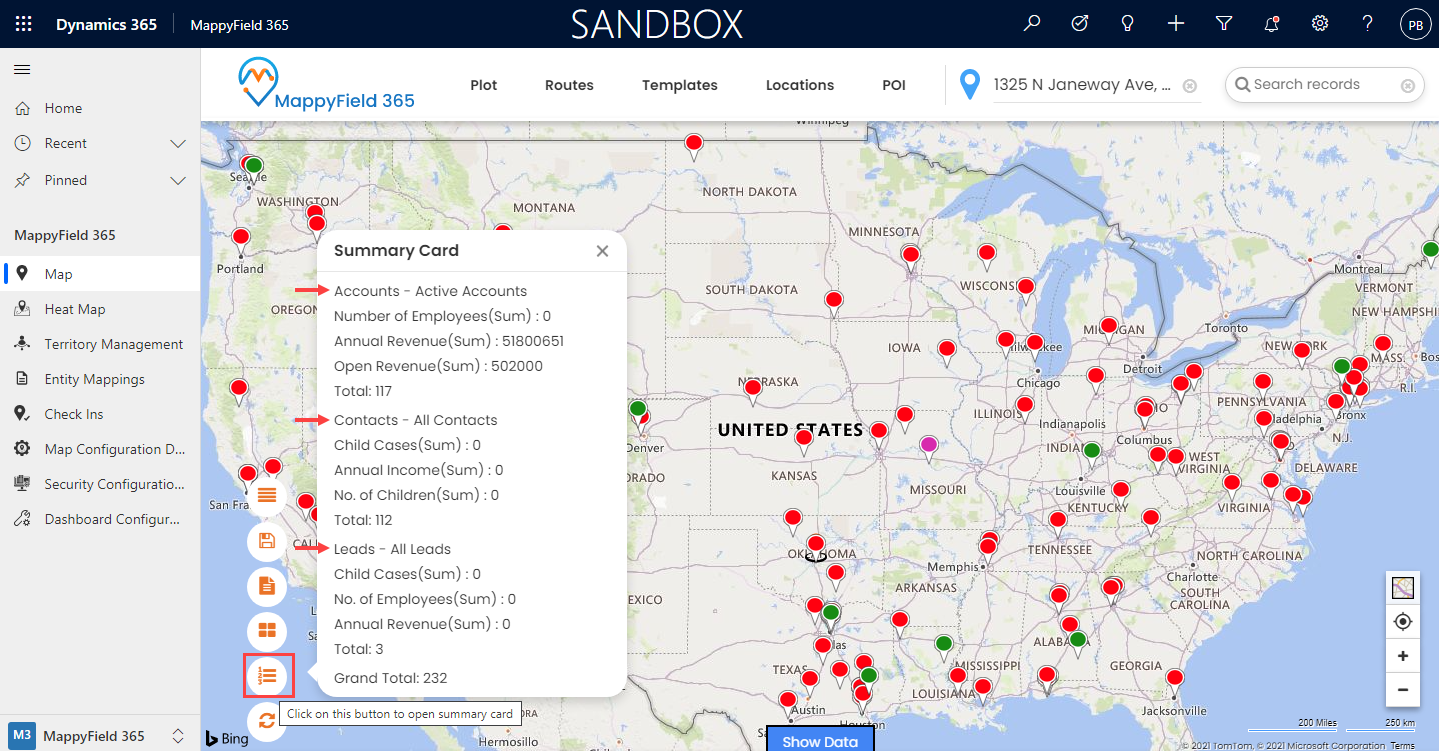
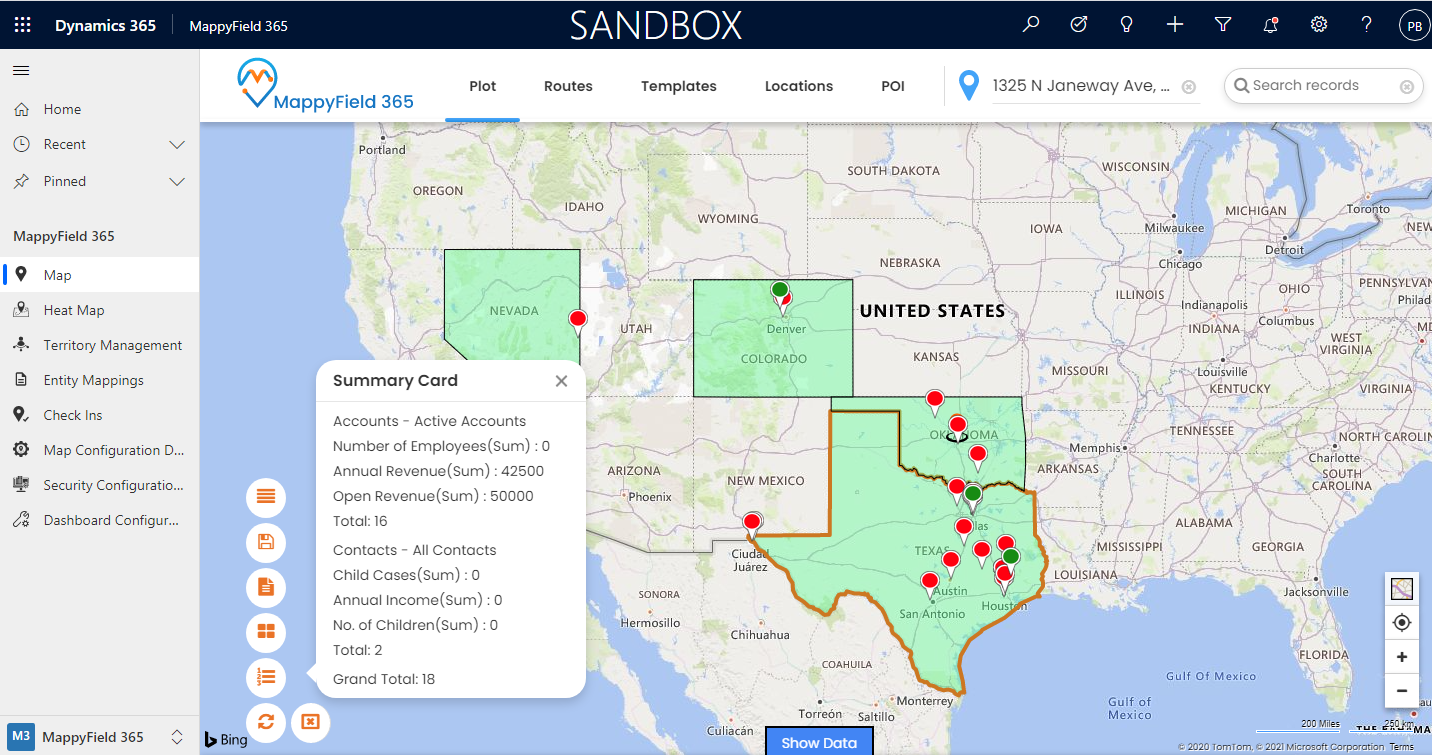
– Check the plotted records details in summary
Summary Card Configurations
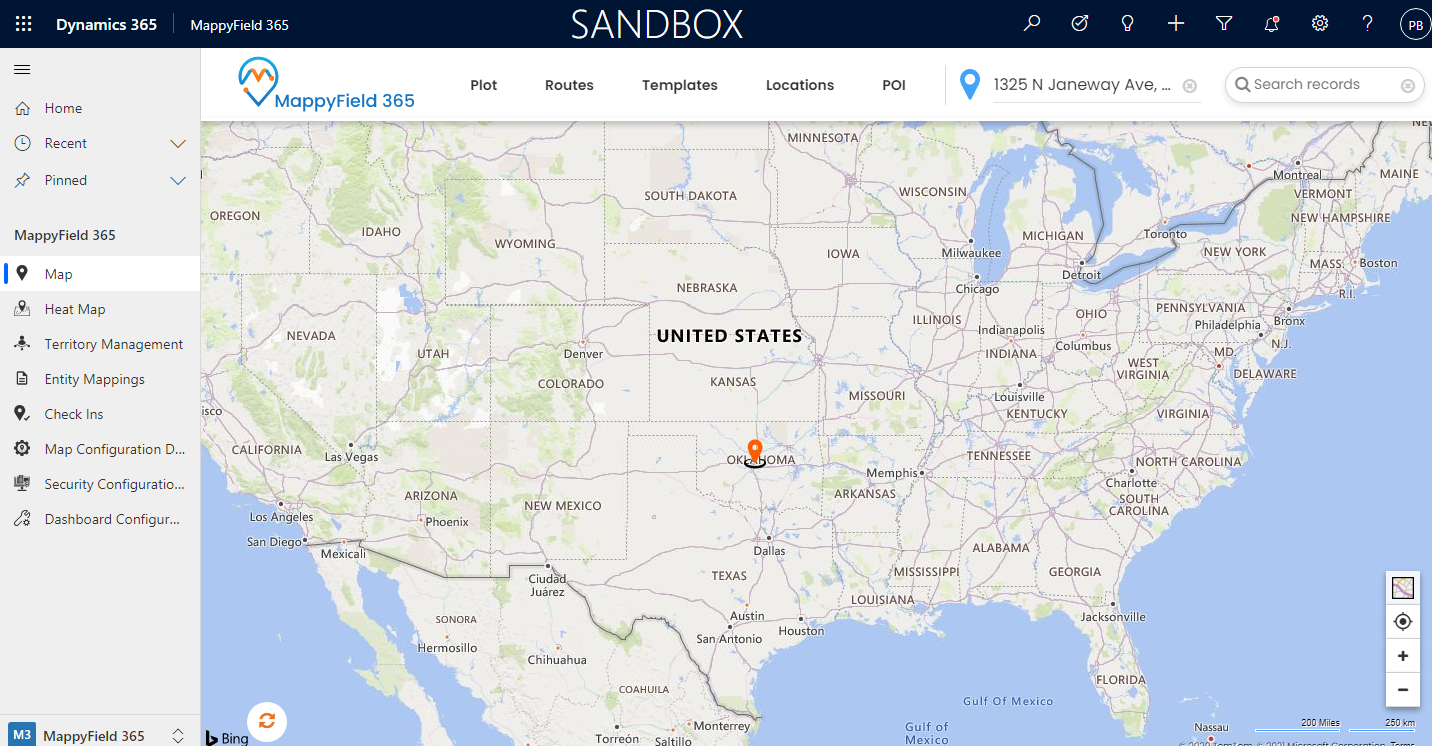
Step 1: Navigate to MappyField 365
After logging into Dynamics 365, click on “MappyField 365” from the Dynamics 365 apps dashboard.
Step 2: Navigate to the Entity Mappings
By clicking on the “Entity Mappings”, you will get the existing list of entities that are already configured. By clicking on the +New from the ribbon, you can add a new entity or edit and configure the existing one.
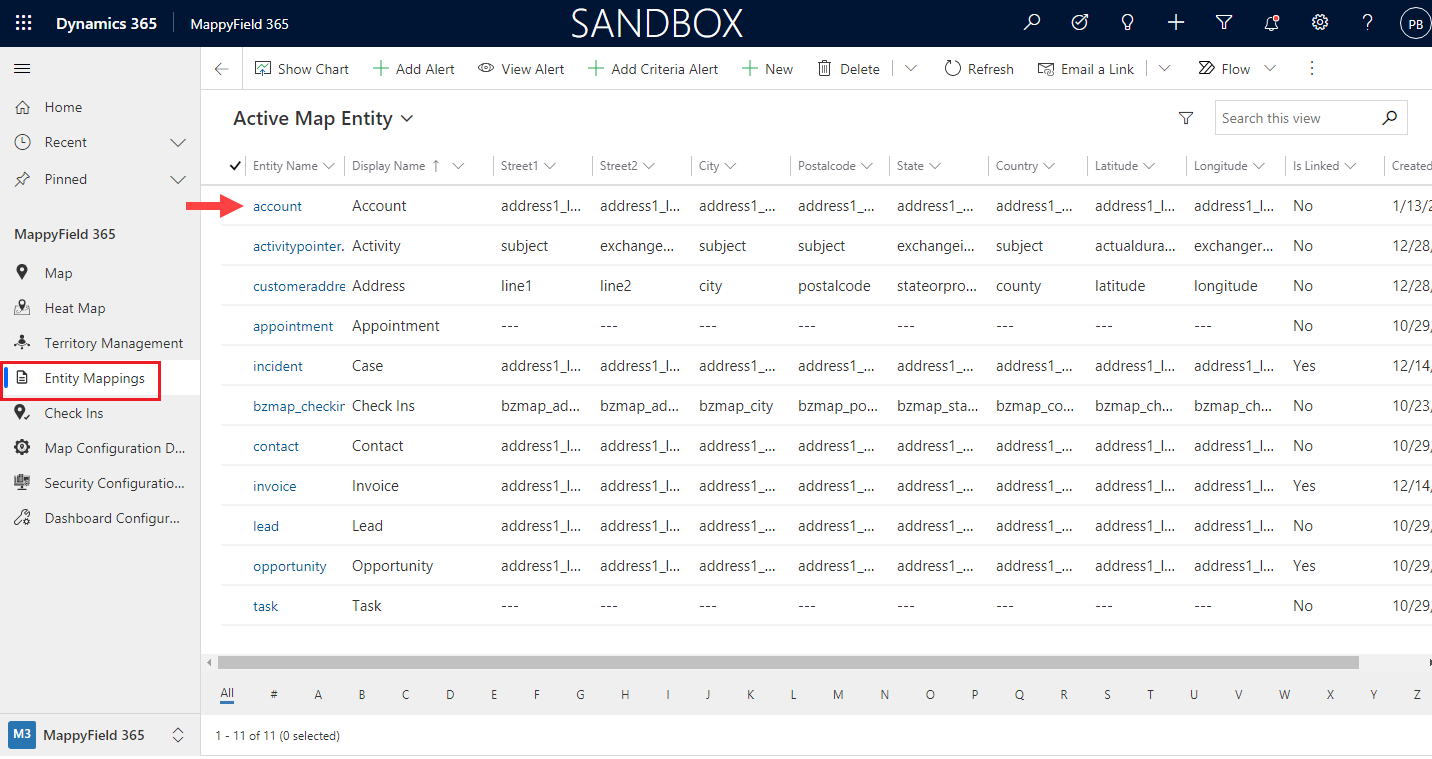
From the ribbon menu, click on the Edit button.
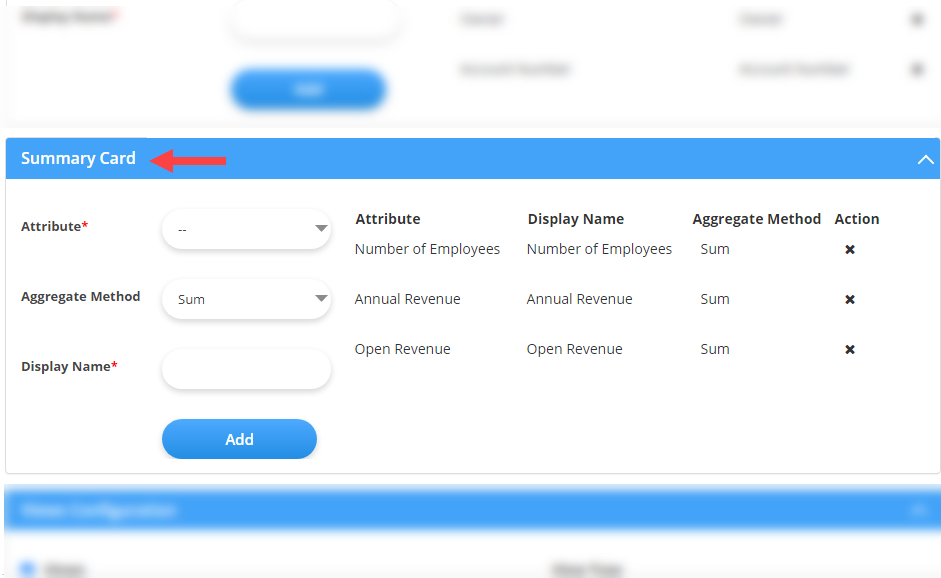
Step 3: Summary Card details configuration
Scroll down to the ‘Summary Card’ section, select the Attribute (field), and aggregate method for that field.
Here we have selected two fields:
→ No of employees and Sum as an aggregate method
→ Annual Revenue and Average as an aggregate method
→ Open Revenue and Average as an aggregate method
Summary Card on map
Step 4: Navigate to MappyField 365
Let’s see how you can access a Summary Card on the map.
After logging into Dynamics 365, click on “MappyField 365” from the Dynamics 365 apps dashboard.

Step 5: Plot records on MappyField 365 map
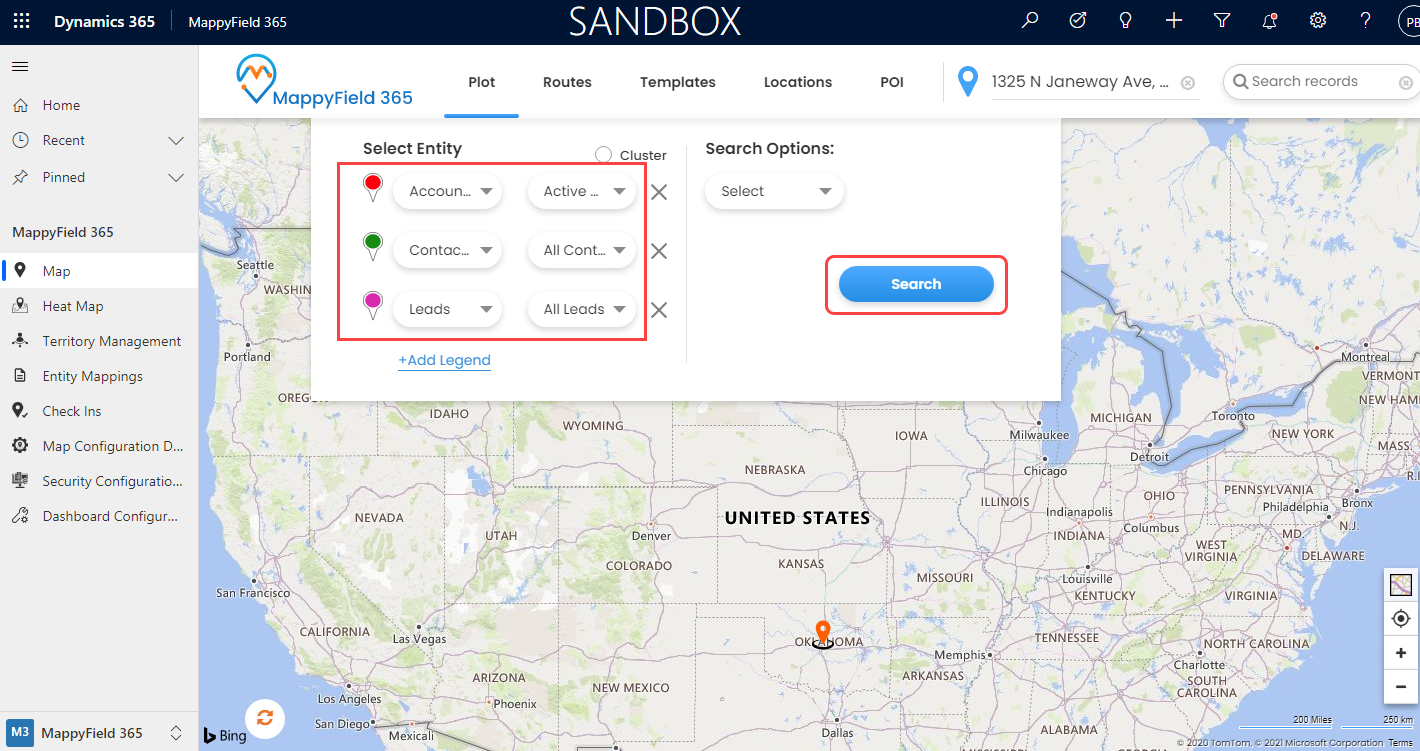
Now, plot the records on the map by selecting the CRM entities that are configured from Entity mappings.
Under the Plot tab, select the Entity and its Records view.
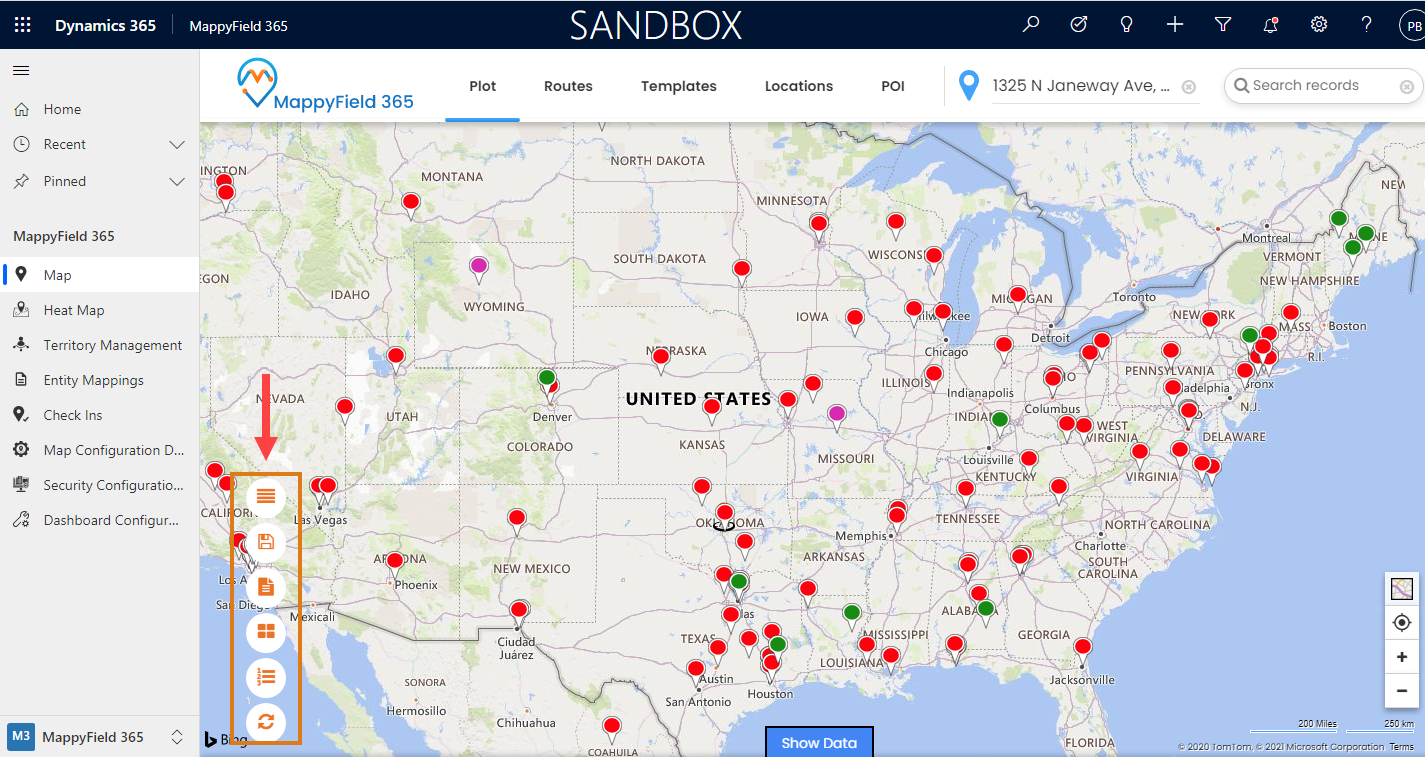
By clicking on that ‘Summary Card’ icon, you will see a popup that has aggregated data of plotted entities.
In this way using AppJetty MappyField365 map integration of Dynamics CRM, you can manage all the CRM entities on the map and perform many actions.
All product and company names are trademarks™, registered® or copyright© trademarks of their respective holders. Use of them does not imply any affiliation with or endorsement by them.


