

Sometimes it’s difficult to search specific records for specific regions, especially when they are scattered in the same fields. In such scenarios, drawing shapes would be beneficial. Hence, the MappyField MS Maps tool provides ways to plot and filter the data. You can draw different shapes like polygons, circles, or rectangles and plot data within the enclosed boundaries of the shape.
Microsoft Mapping Tools such as MappyField 365 also allow you to display a shape’s size and dimension. Here’s how to view the measurement of drawing shapes.
To draw the shapes and view dimensions in MappyField 365:
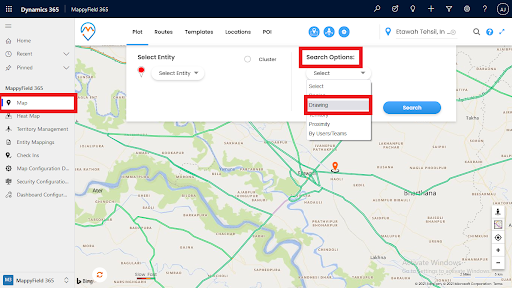
Step 1: Go to the Map tab.
Step 2: Select the Plot tab from the top navigation for the drawing tool.
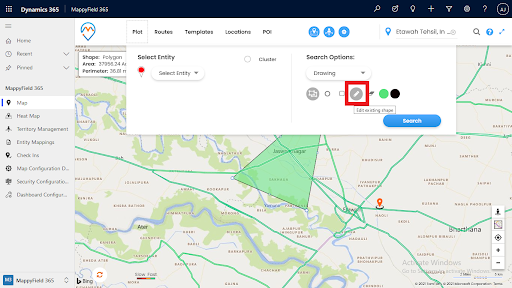
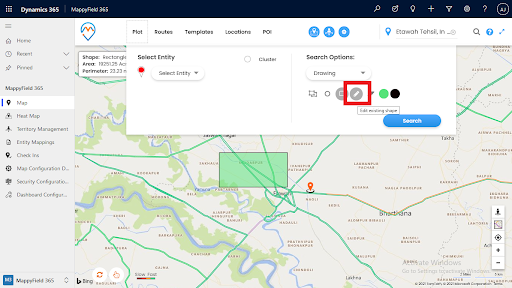
Step 3: From the Search Options dropdown, select the Drawing option.
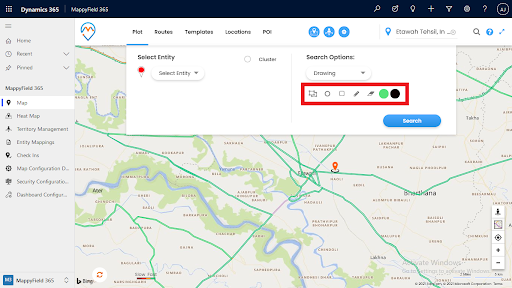
Step 4: Here, you can view different drawing shapes. Select the drawing shape such as polygon, circle, or rectangle.
Suppose you have selected a polygon. Here’s how to draw it and show the measurement.
Draw Polygon
Step 1: Select the Polygon drawing shape from the drawing tool options.
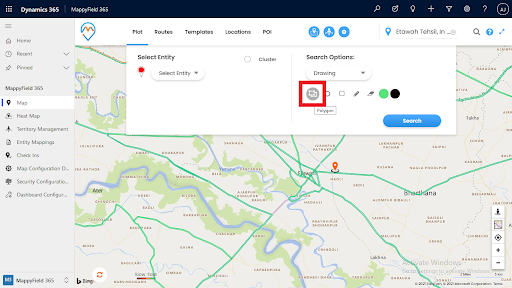
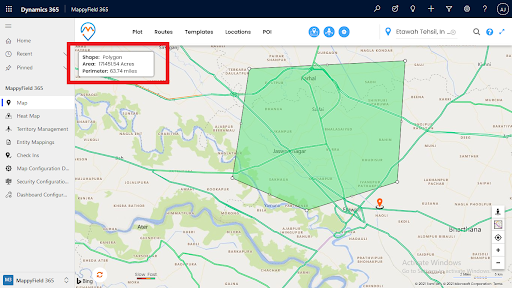
Step 2: Draw a polygon onto the Map tab.
Step 3: At the time of drawing, it will show a measurement of the polygon, such as the area and perimeter of the polygon.
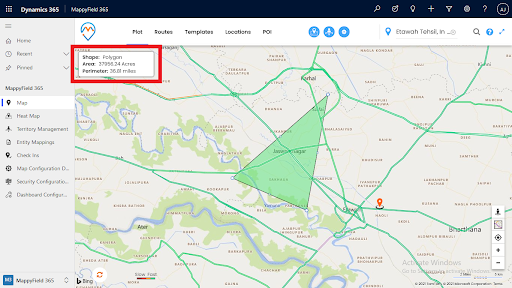
Note: The measurement of the polygon will change according to the modifications you make. You can even edit it by clicking on the Edit option.
After editing the shape, it will show a resultant measurement output according to it.
Draw Circle
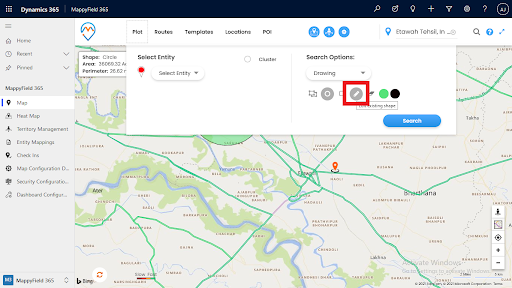
Step 1: Select the Circle drawing shape from the drawing tool options.
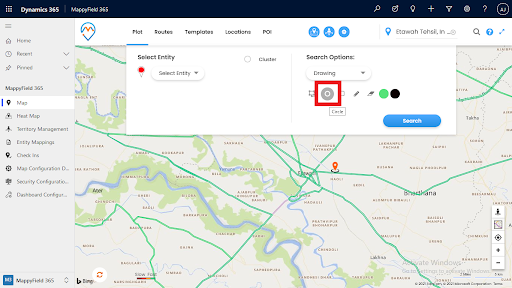
Step 2: Draw a circle on the Map tab.
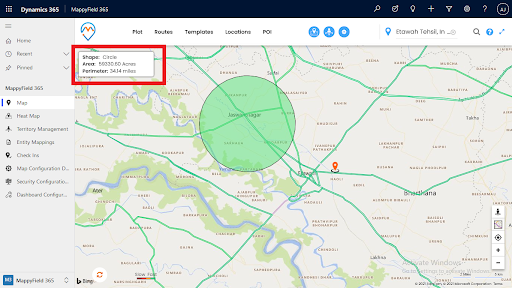
Step 3: At the time of drawing, it will show a measurement of the Circle. You can view the area and perimeter of the circle.
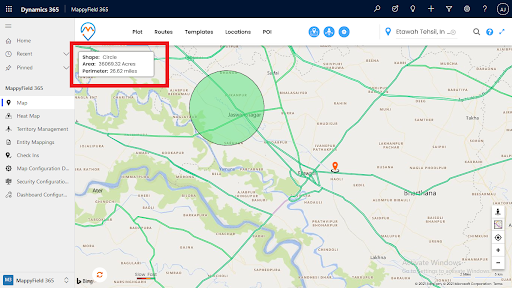
Note: Output of the measurement will change if you edit the shape or modify it. For editing, click on the Edit Shape option.
After editing, you can view the resultant measurement output according to the shape.
Draw Rectangle
Step 1: Select the Rectangle drawing shape from the drawing tool options.
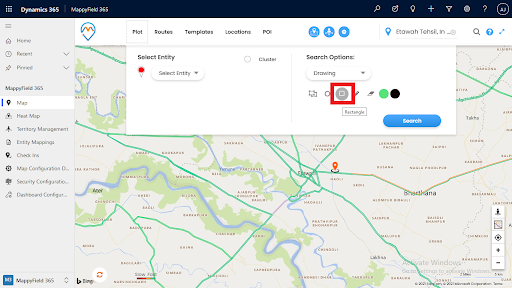
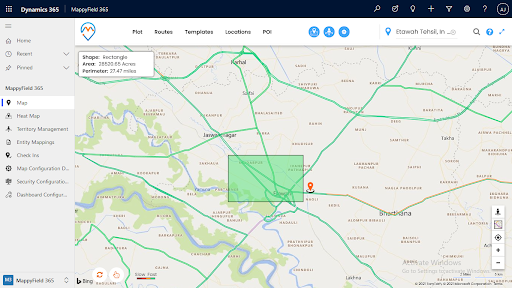
Step 2: Draw a Rectangle on the Map tab.
Step 3: You can view the measurement at the time of drawing, such as the rectangle’s area and perimeter.
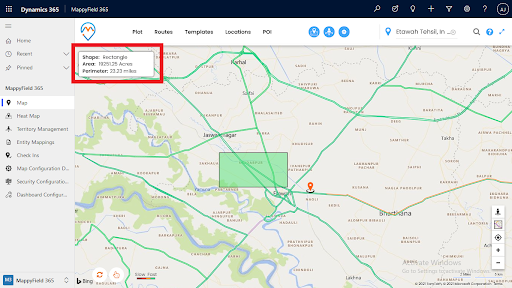
Note: Output of the measurement will change as you edit the shape or modify it. To change the shape or size, click on the Edit Shape option.
After editing the shape, you can view the resultant measurement.
Drawing shapes feature in MappyField 365 will show the exact measurements and make it easy for you to visualize the data.
All product and company names are trademarks™, registered® or copyright© trademarks of their respective holders. Use of them does not imply any affiliation with or endorsement by them.


