

Maps are a great way to visualize location-based data and records. If you have multiple records (pushpins/markers) close to each other, it can be hard to check the plotted records on the map. The map clustering feature helps combine the closer records (pushpins) into a group.
MS DynamicsCRM/365 mapping plugin, “AppJetty MappyField 365” with Bing map integration provides a Map Clustering feature for better visualization and analyzing the CRM records on the map.
With MappyFIeld 365 map, plot multiple CRM entity records on the map and manage the CRM entities & activities from the map itself. Map Clustering is a small but one of the most important features of the MappyField 365.
In this blog, we will explain how the “Cluster Map” feature works.
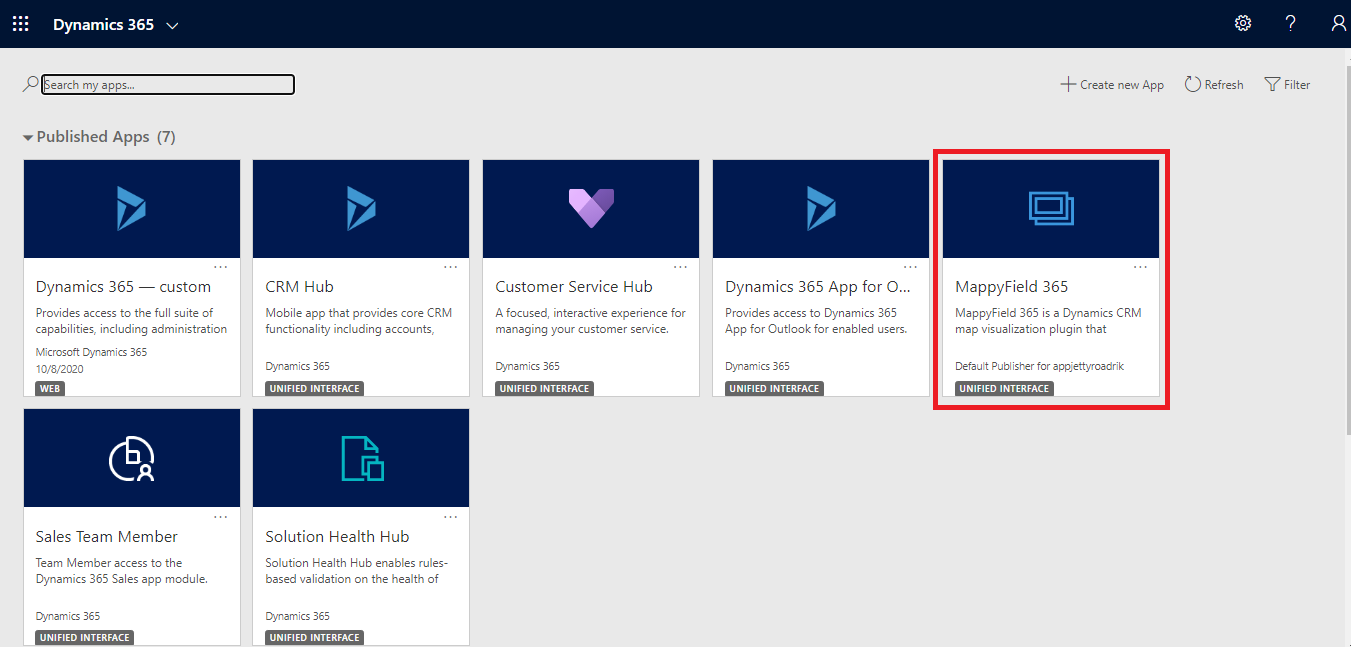
Step 1: Navigate to MappyField 365
Select “MappyField 365” from the Dynamics 365 dashboard or app list.
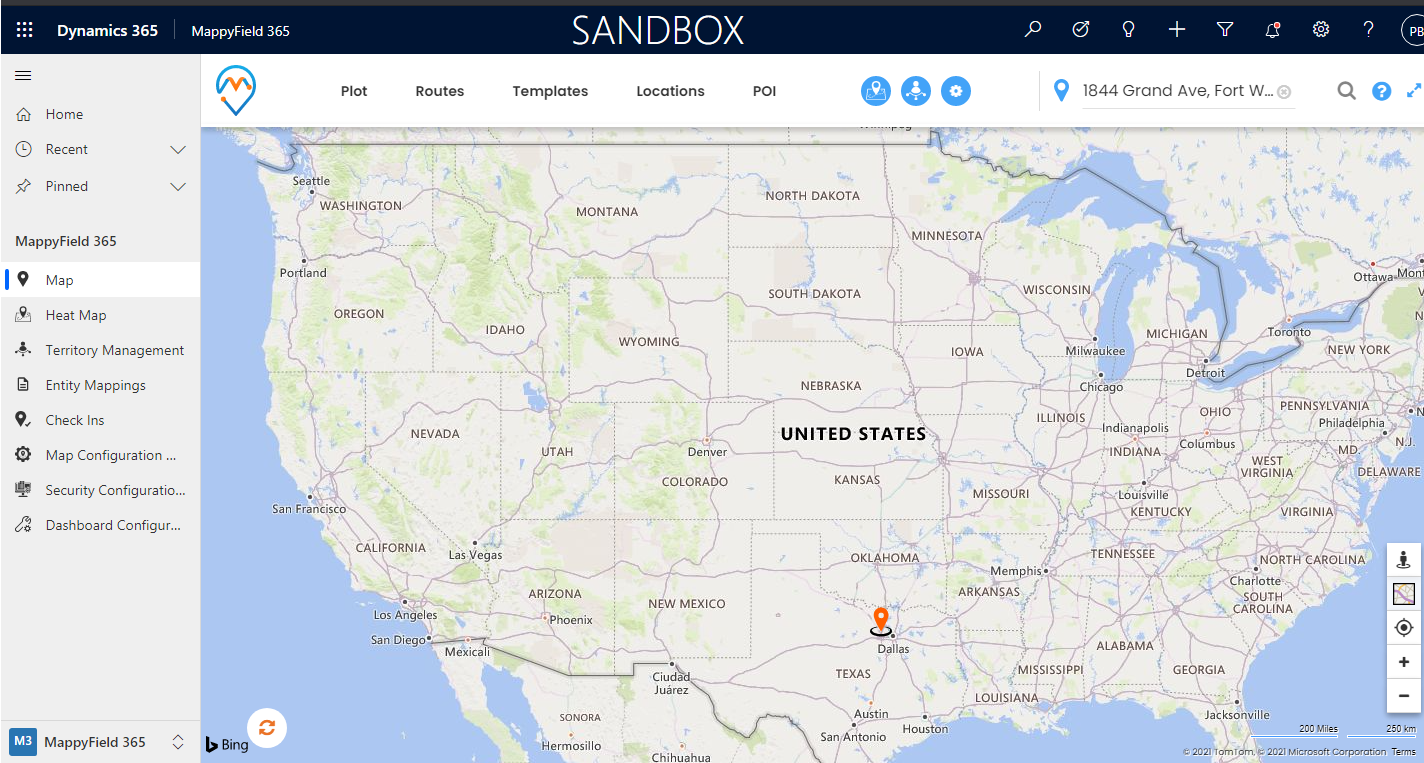
By default, you will be navigated to the “Map view” of the MappyField 365 with all the default configurations.
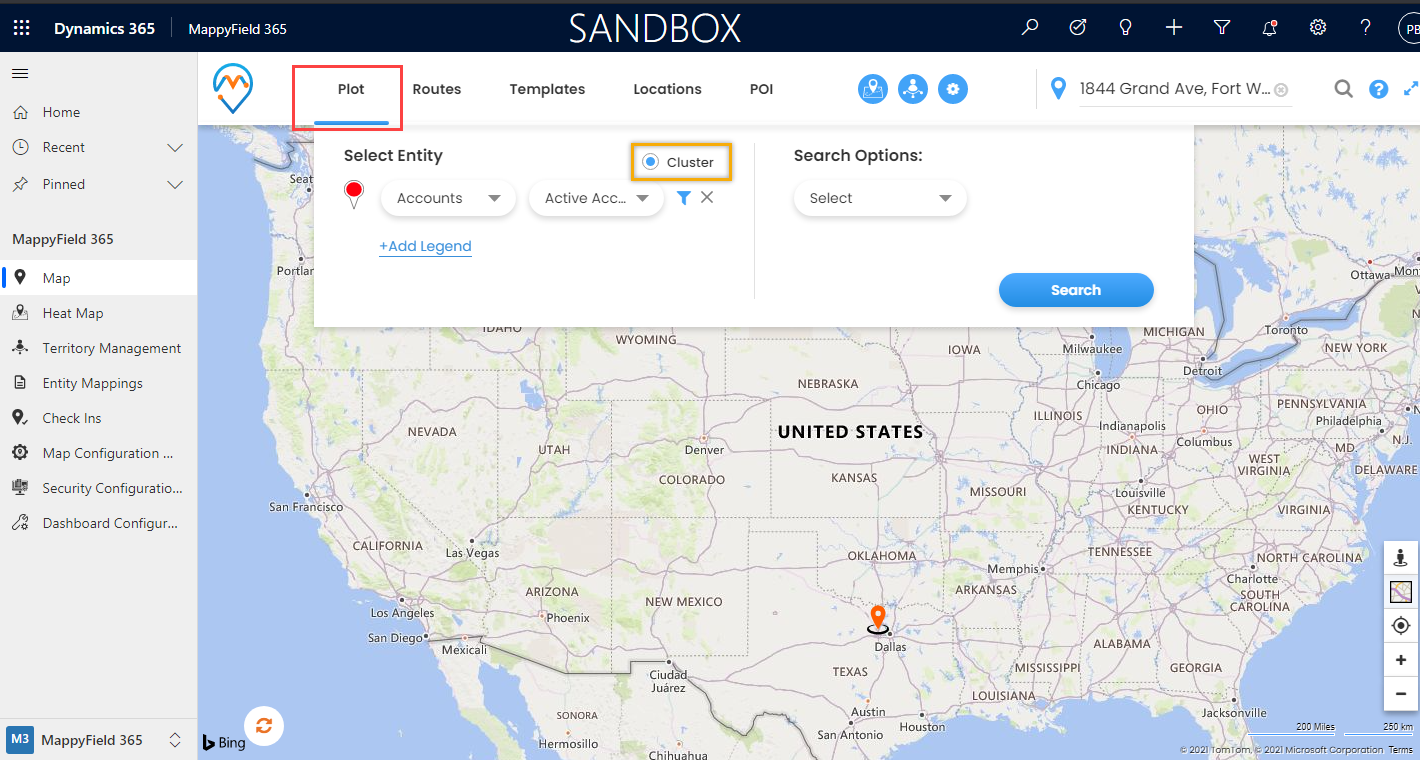
Step 2: Navigate to the “Plot” menu
You will find the “Cluster” option under the “Plot” menu. You need to select the CRM Entity with its view records.
After selecting the Entity with its view and enabling the “Cluster”, click on the “Search” button. The entity records will be plotted into the group (divided into small chunks) that is called a Cluster.
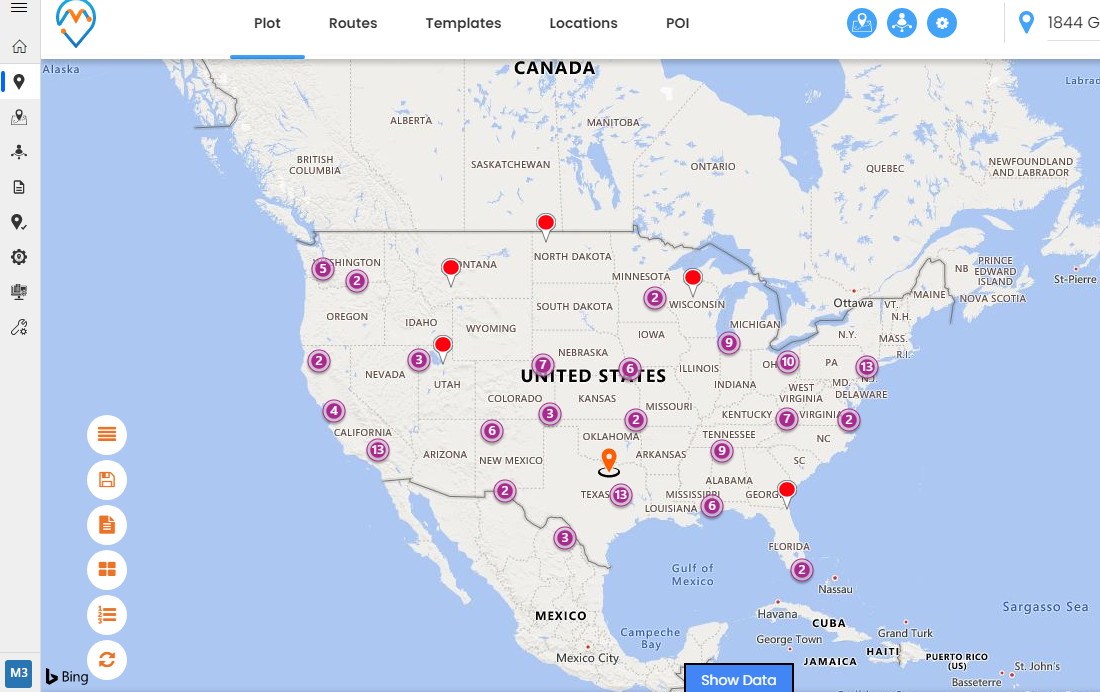
Here, the number on a cluster indicates how many records (pushpins) it contains.
Sometimes when there is more than one record with the same location/address (same latitude and longitude), you will see more than one push pin that overlaps on another. They will resemble one pushpin but if you have enabled the “Cluster” map option, it will display in the group.
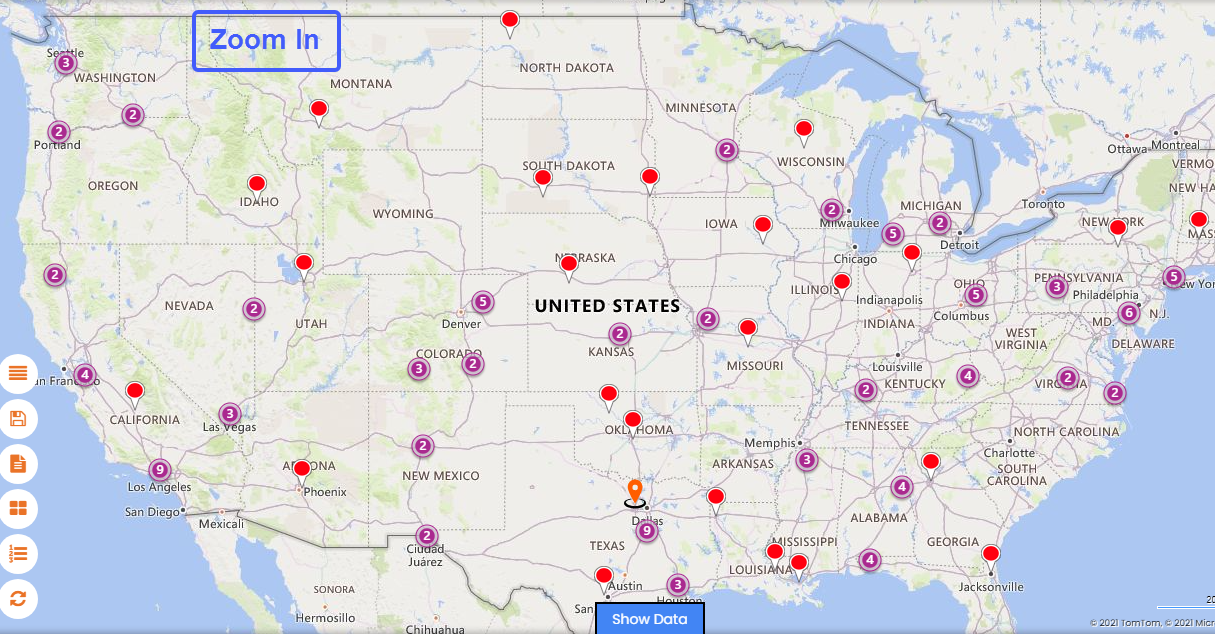
Step 3: Increase/Decrease cluster records as per Zooming level
As you “Zoom In” the Map or Zoom into any of the cluster locations, the number on the cluster decreases and you will see the individual pushpins on some of the locations on the map.
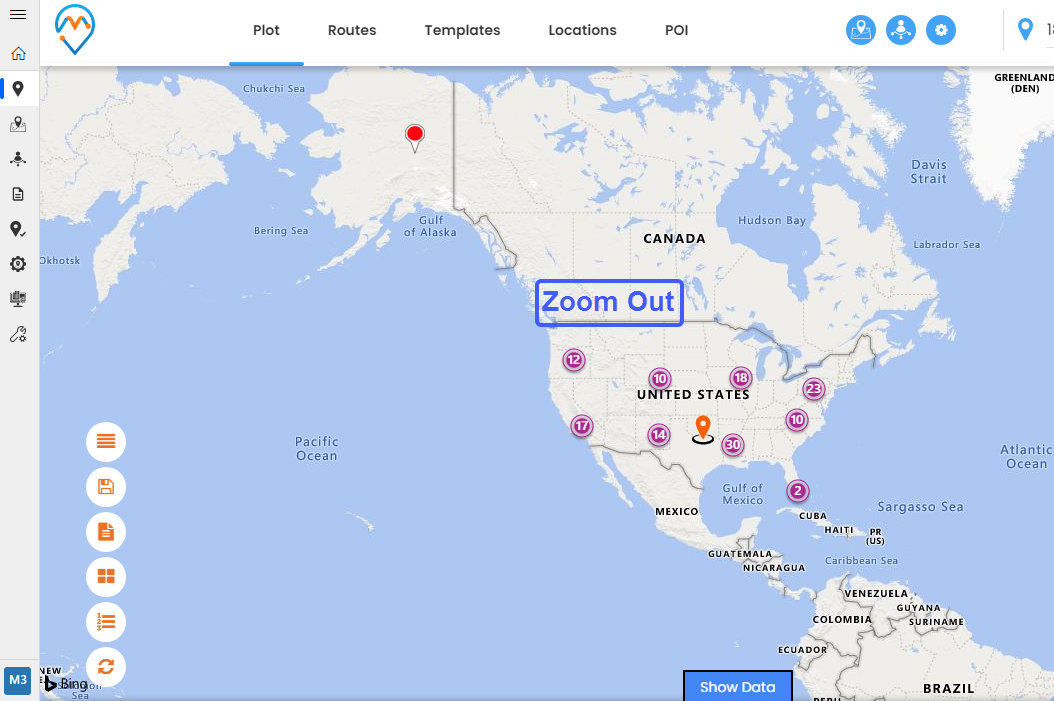
But if you “Zooming Out” of the map, the number on the cluster decreases and consolidates the pushpins into clusters again or closer clusters into one cluster.
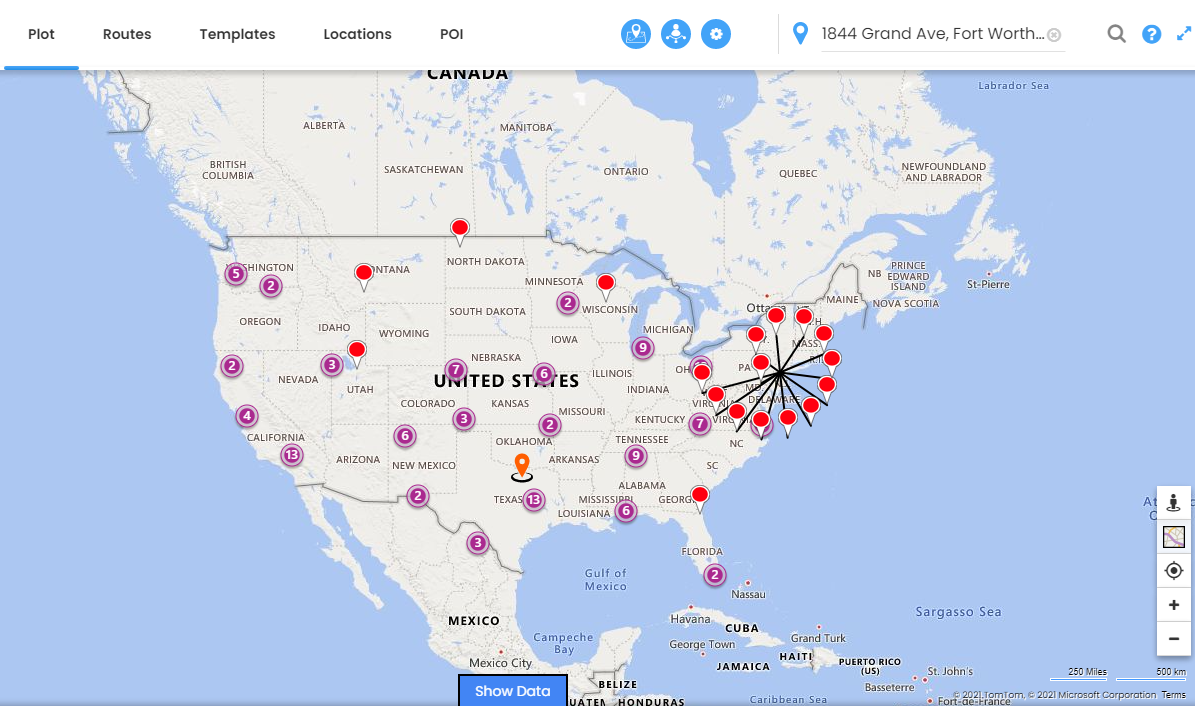
Step 4: Spider Cluster
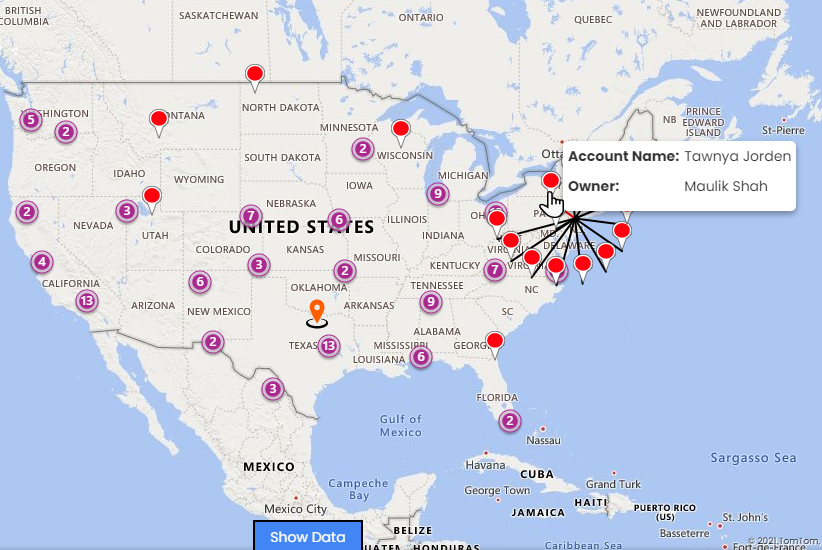
When you click on the cluster that indicates the number, it opens all data around that point. This is called Spider Cluster.
By hovering on any pushpin (a record), you will get the details of that CRM record.
So, the Map Clustering feature will help to get closer located records into a cluster and you can avoid the overlapping of the pushpins.
Microsoft DynamicsCRM Geo-analytical app AppJetty MappyField 365 can help to analyze the CRM records on the map. With the help of the MappyFIeld365 features, you can track the CRM activities, manage and schedule the activities from the map itself.
If you want to know about any feature regarding AppJetty MappyField 365, feel free to reach out to us at [email protected] or you can just click on the “Contact Us”.
All product and company names are trademarks™, registered® or copyright© trademarks of their respective holders. Use of them does not imply any affiliation with or endorsement by them.


