

Sales is a game of numbers. We’ve all heard it. But it has evolved from numbers to visuals. As a sales manager, you don’t have to crunch numbers all the time when you can simply see sales data on the map.
And in this blog, we are going to demonstrate how to visualize region-wise CRM data in a Dynamics CRM map integration. By visualizing CRM data region-wise, you get an overview of how your regional sales and marketing team are performing which can help you make data-driven decisions.
Without further ado, let’s dive into how you can visualize region-wise CRM data on a map.
Note: For this example, we’ve taken Mappyfield which is a dynamics 365 field mapping tool. You can explore more such extensions from MS AppSource.
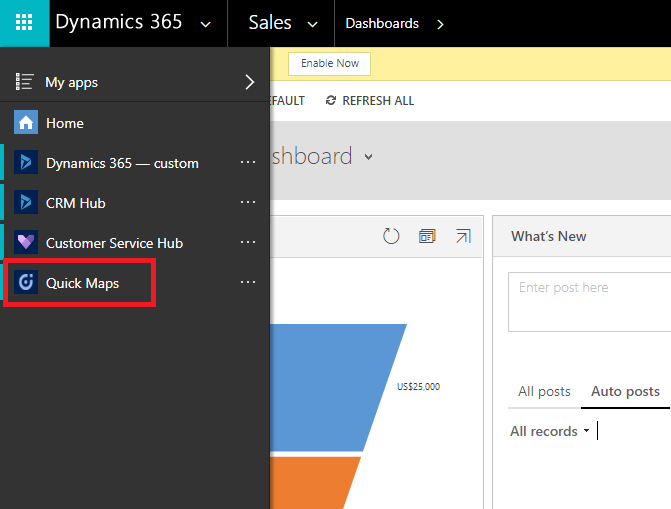
Step 1: Redirect to “Map” page
Click on the Dynamics 365 menu and then click on “Mappyfield” from the slider menu or find the “AppJetty” tab from the header menu and click on Maps to open Mappyfield.
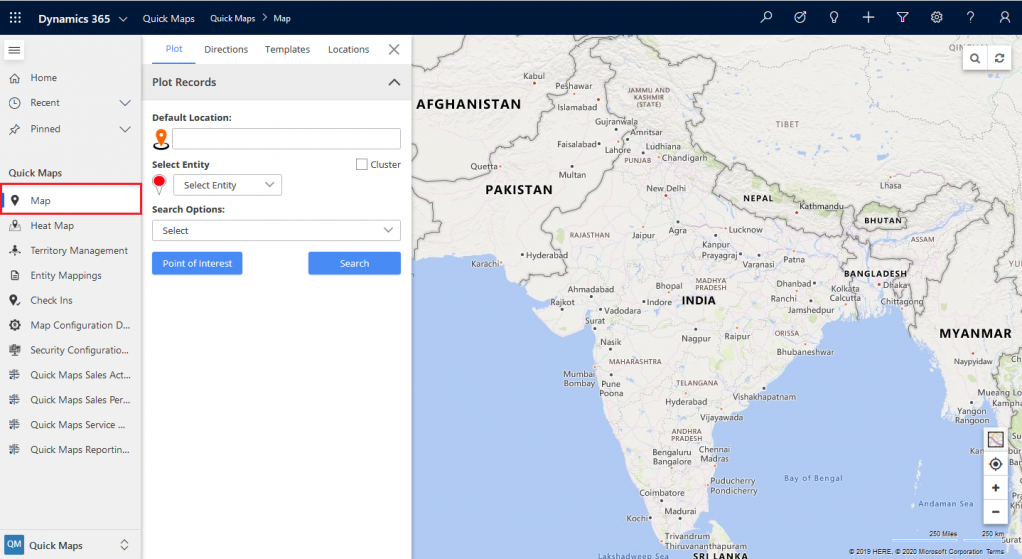
Step 2: Select the Entities you want to view records of on the map. In other words, visualize.
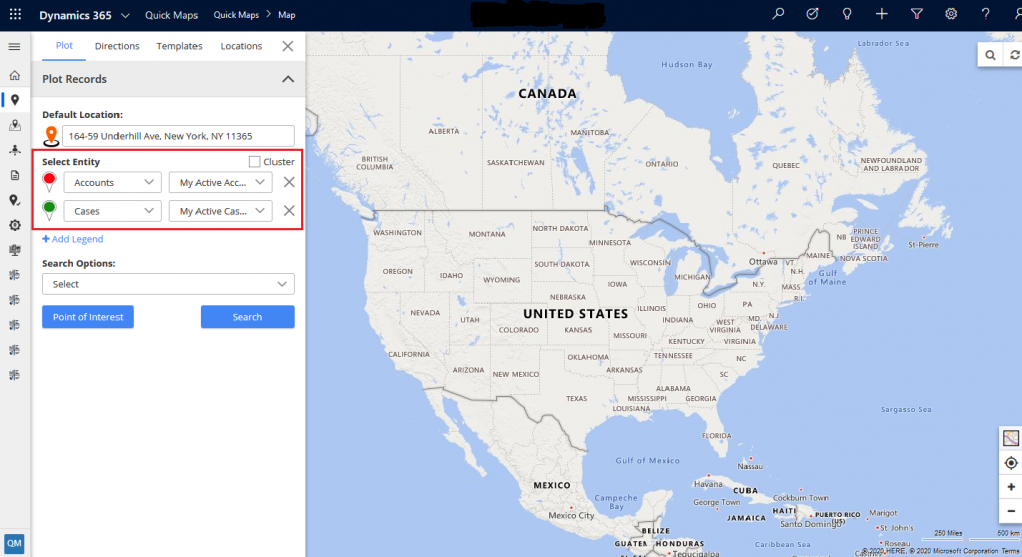
Note: Here you can select up to 5 entities to map and visualize its data.
Step 3: Add Multiple Regions to visualize data
– Select “Region” from “Search Options” dropdown.
– Select the region type from “Region” dropdown. The available options are City, State, Country, and Postal Code.
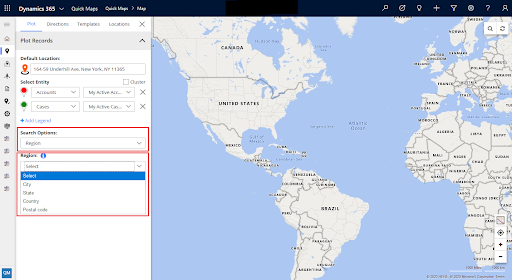
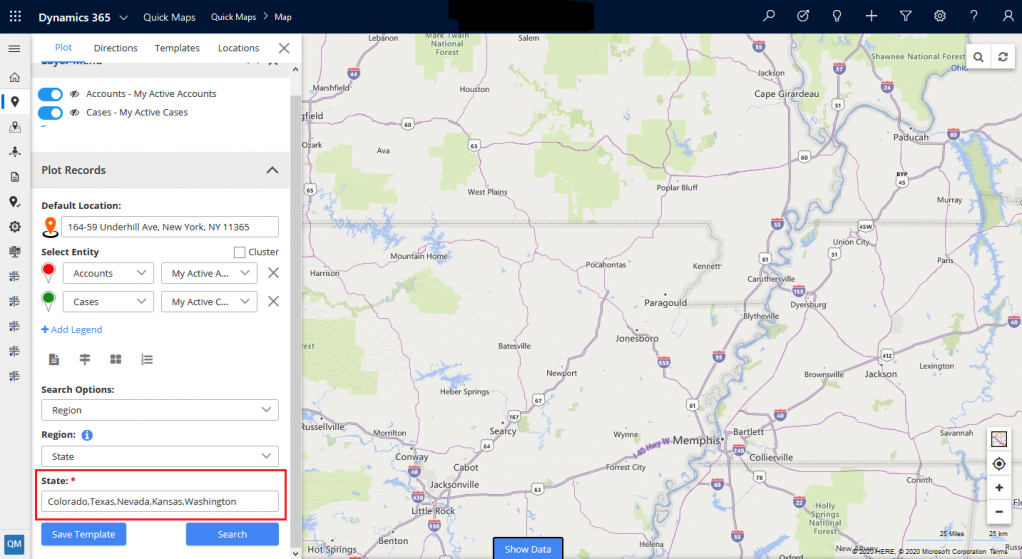
After adding all the required data, click on the search button to visualize your data.
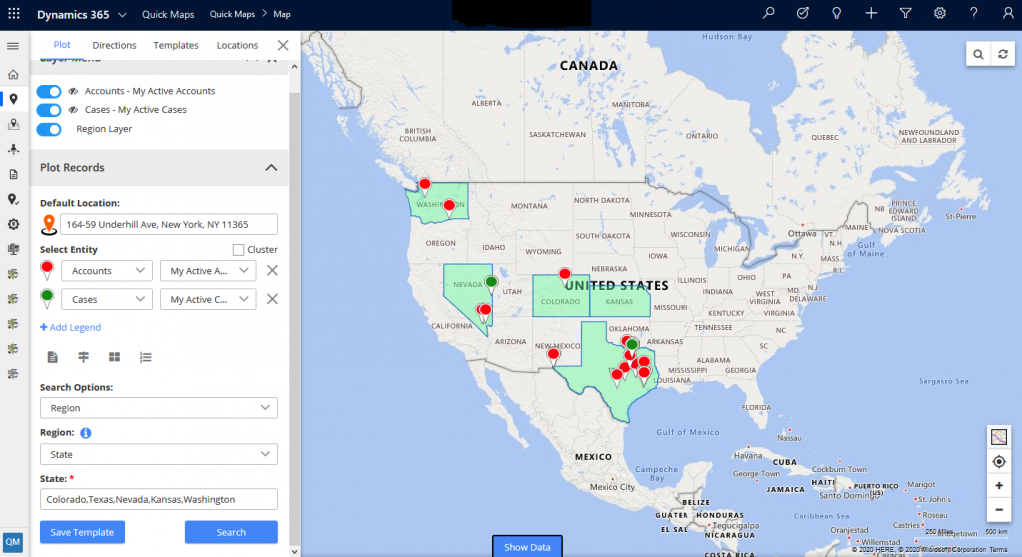
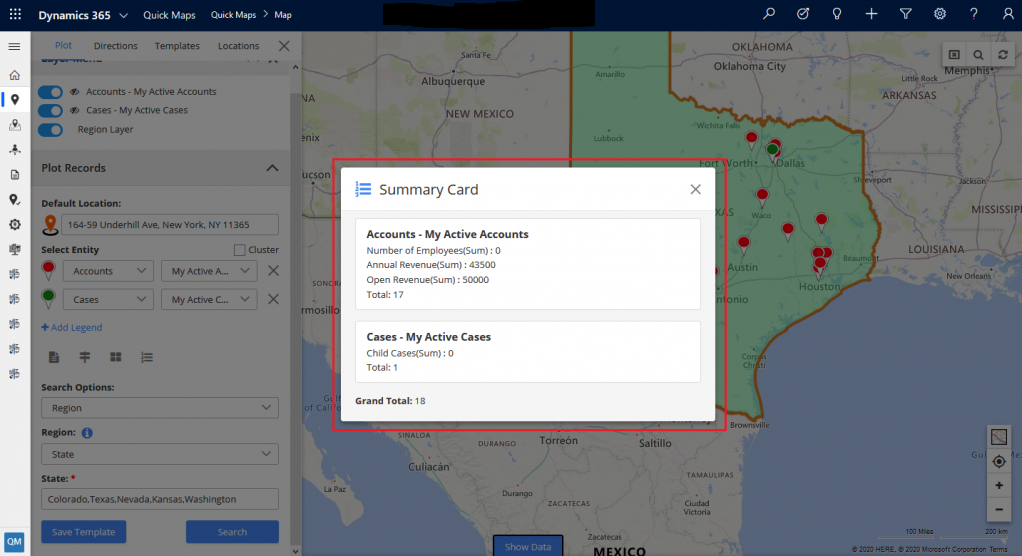
Now if you want to view region summary and data/records inside that region you need to click on the region and it will display the summary that particular region. The selected region will be highlighted with a different border.
If you want to see detailed data of a particular region, click on the ‘Show Data’ button available in the center bottom. Data in Grid View will be according to the selected region.
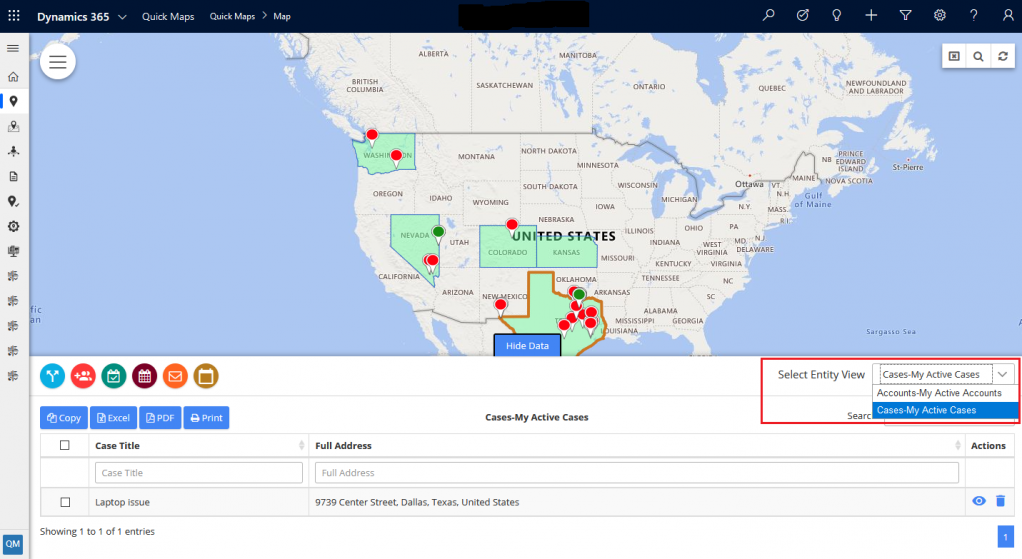
You can select multiple entities from the dropdown of ‘Select Entity View’, if selected region contains multiple entities records/data.
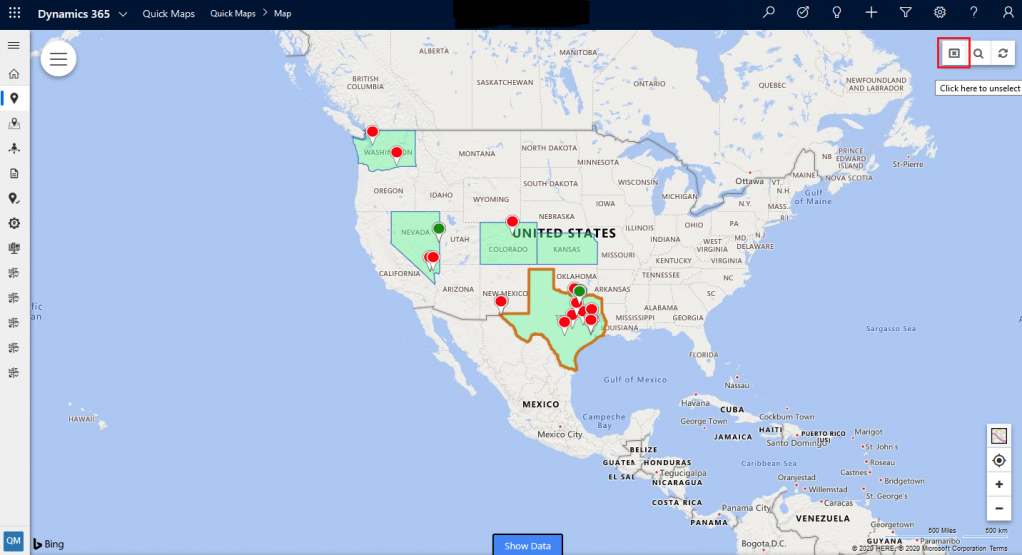
Once you are done understanding the data of a particular region, you can clear the selected region by clicking on the cross button in the top-right corner.
All product and company names are trademarks™, registered® or copyright© trademarks of their respective holders. Use of them does not imply any affiliation with or endorsement by them.


