

The benefits of the heatmap are fruitful. Assume you wanted to know what are your key performing areas, then a heat map can visually represent that information. This will make it easier for you to understand and then take strategic decisions based on it.
In a nutshell, the heat map is an analytical feature that uses color as a tool for data visualization.
With the Dynamics 365 map, you can plot the heat map as per your requirements. You can select the various Data Source, Select Measures, Select Filters, Select Region Type, and much more. Also, you don’t have to configure the heat map everytime, you can set the heatmap template as default. Here is how you can do it in your Dynamics 365 field mapping CRM<.
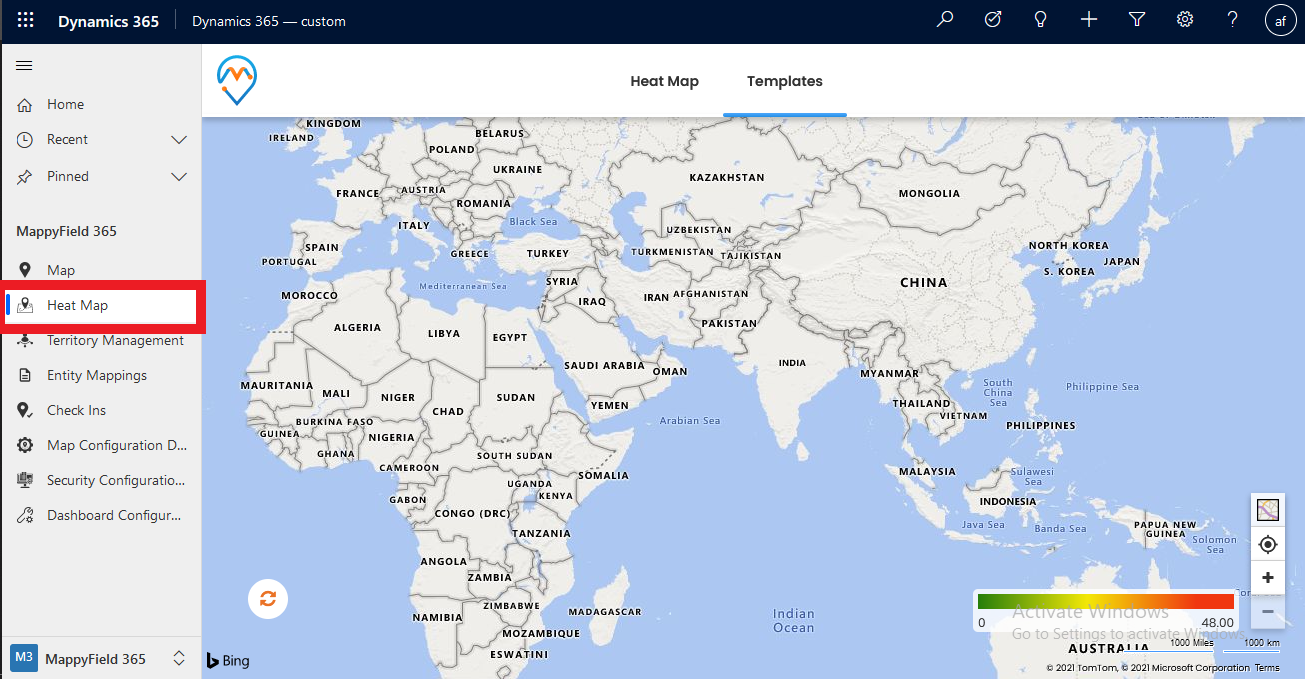
Step 1: Please, select the Heatmap tab under the MappyField 365 from the left-side navigation menu.
Step 2: Click on Heat Map from the navigation available on the top to configure the data items to plot the data on the heat map.
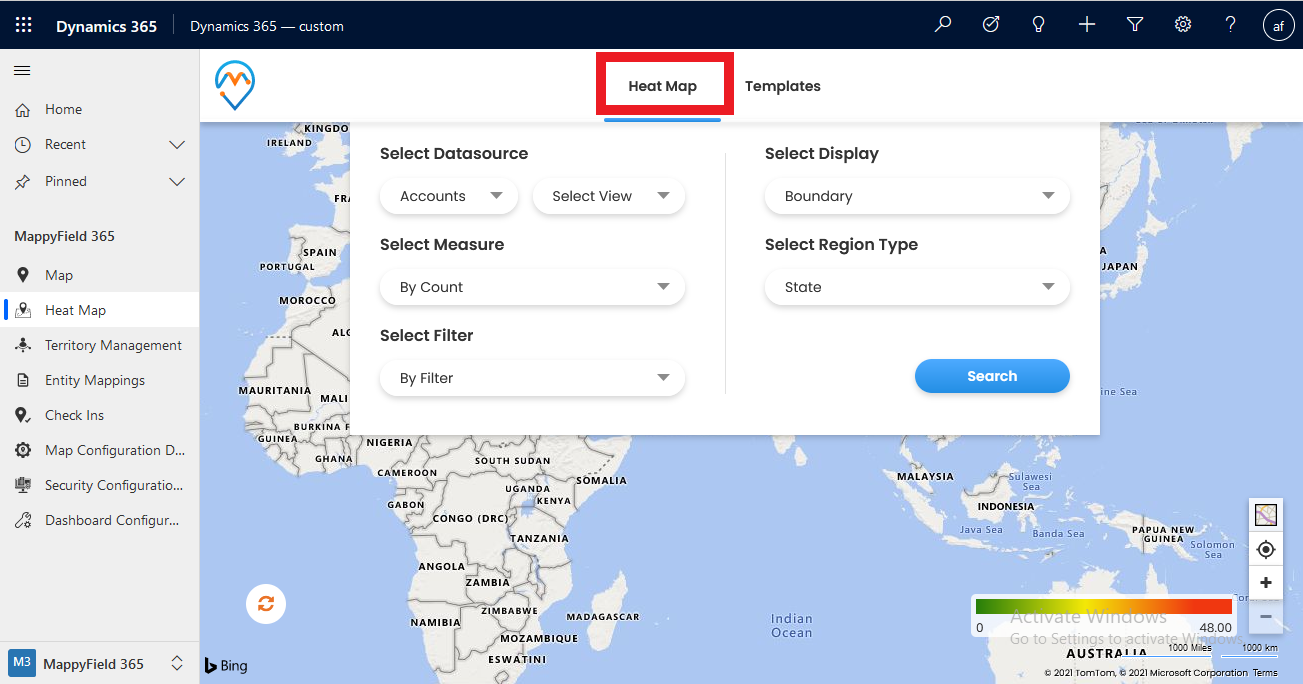
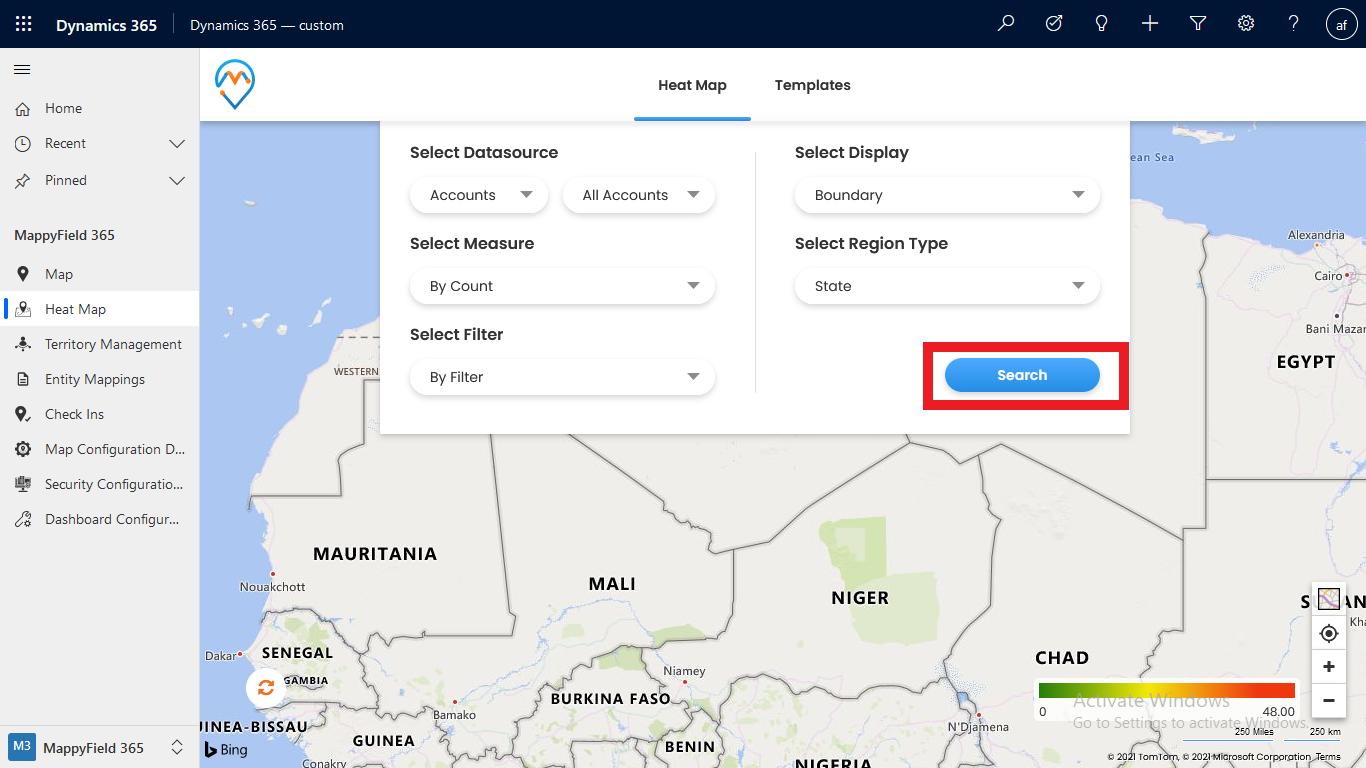
Step 3: Now, configure the plotting details. Select Datasource, view, measures, filters, display, and region type. After configuring, click on the Search button. It will show the result according to it.
Step 3.1: Select Datasource from the dropdown. Datasource is an entity list that is added from the entity mapping. Select entity to plot the data of that entity.
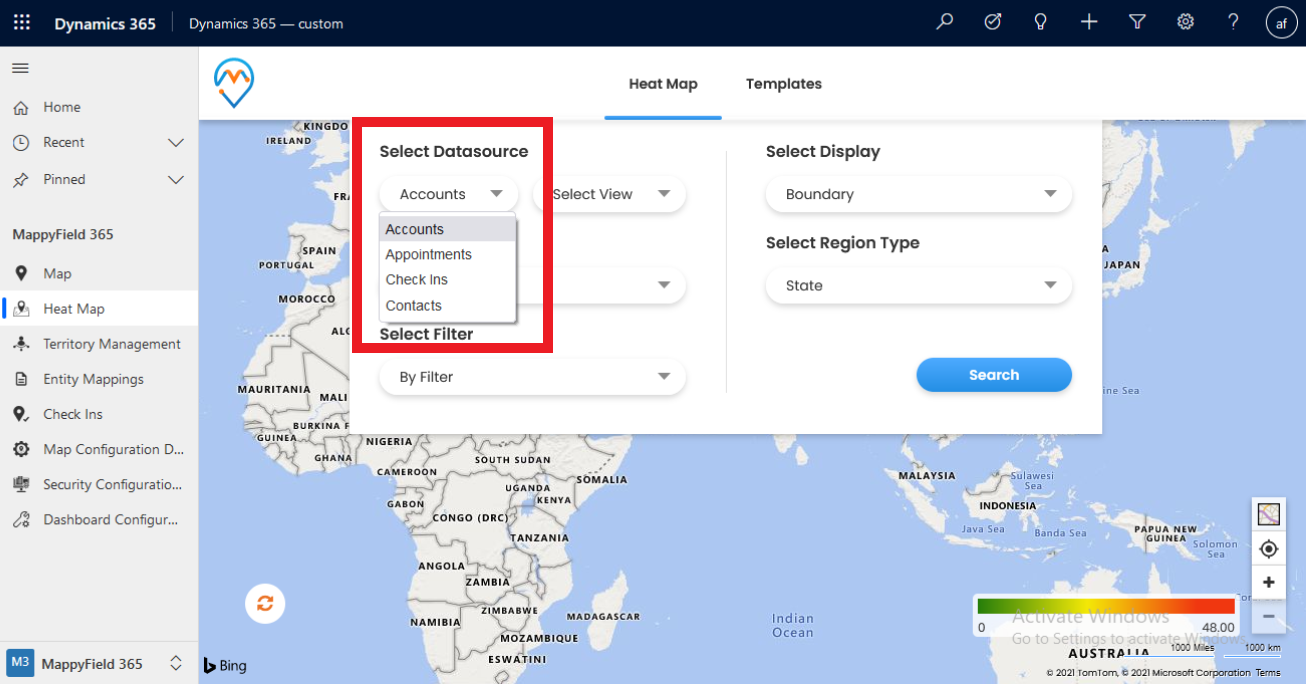
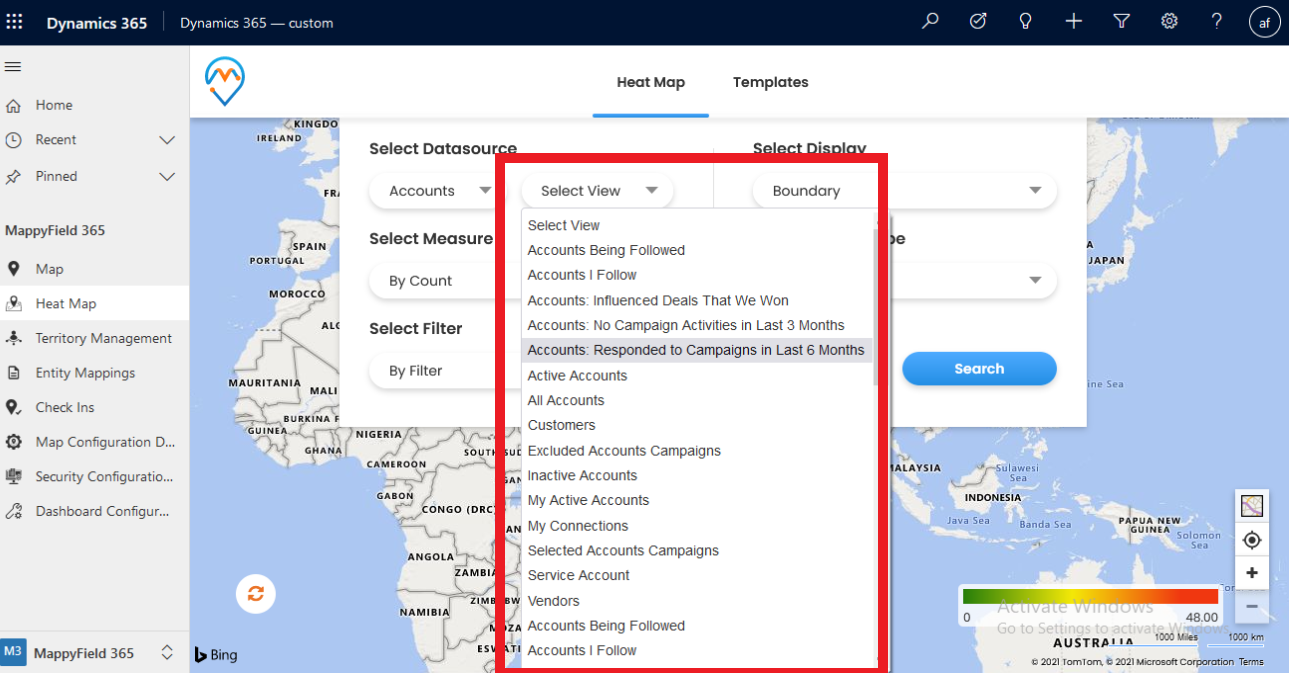
Now select the View according to the selected entity. Such as all accounts, only active accounts want to plot, etc.
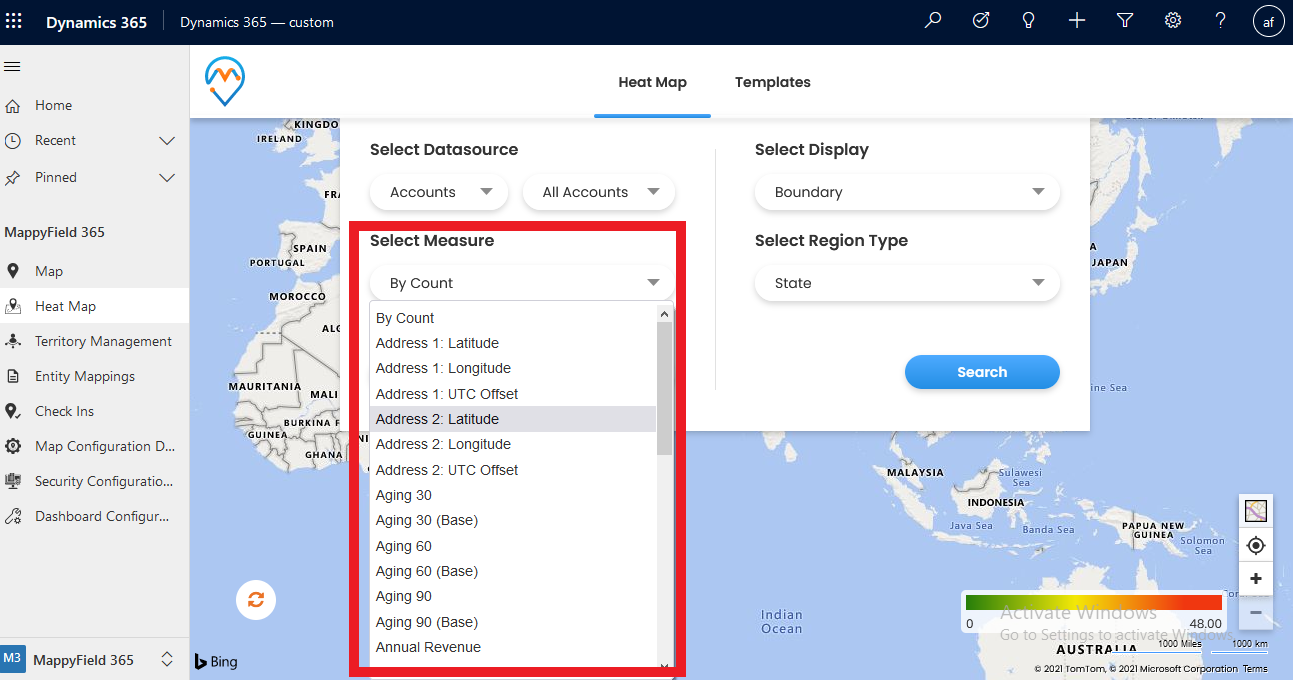
Step 3.2: Select the measure like count and revenue. Based on the selected value of the measurement, it will measure the records.
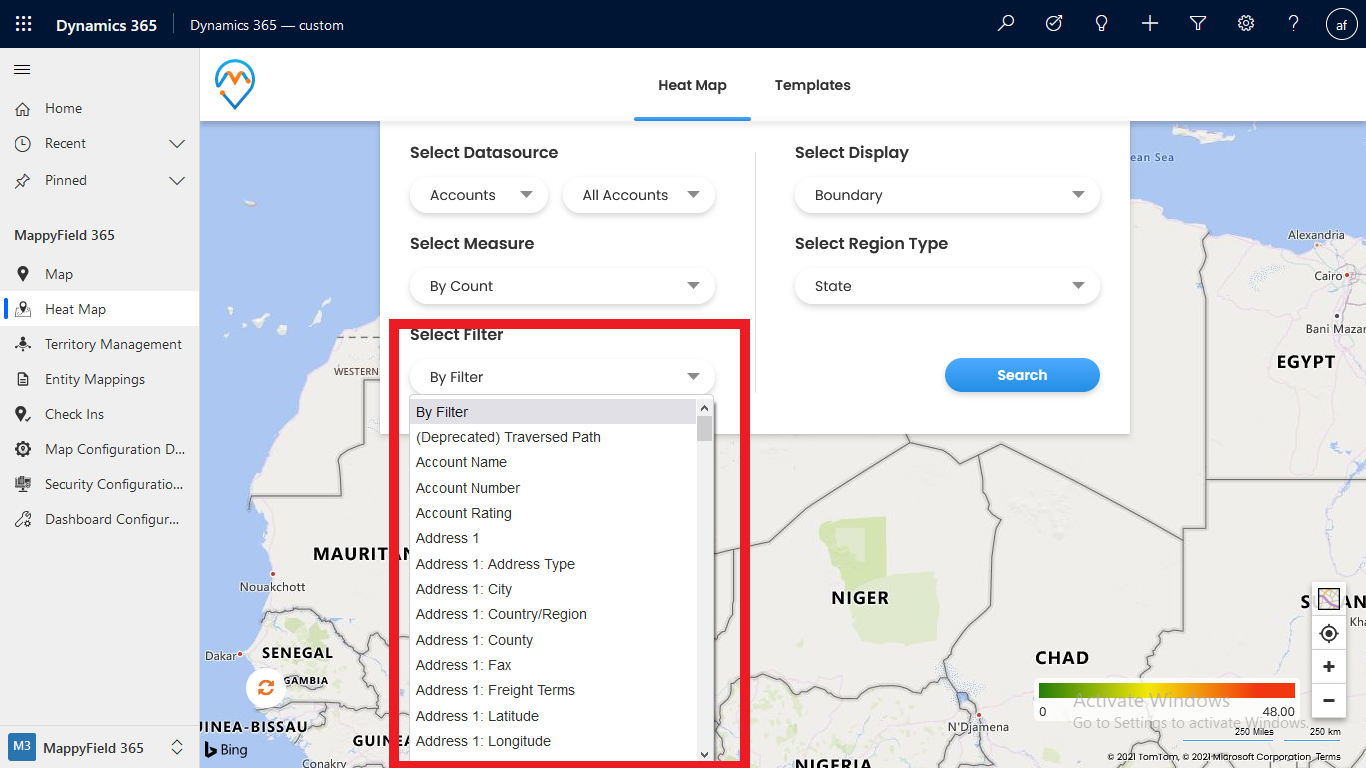
Step 3.3: Apply filter for the records. Select the available filter option. Based on the selected option, it will filter the records of the selected entity and return the matching results.
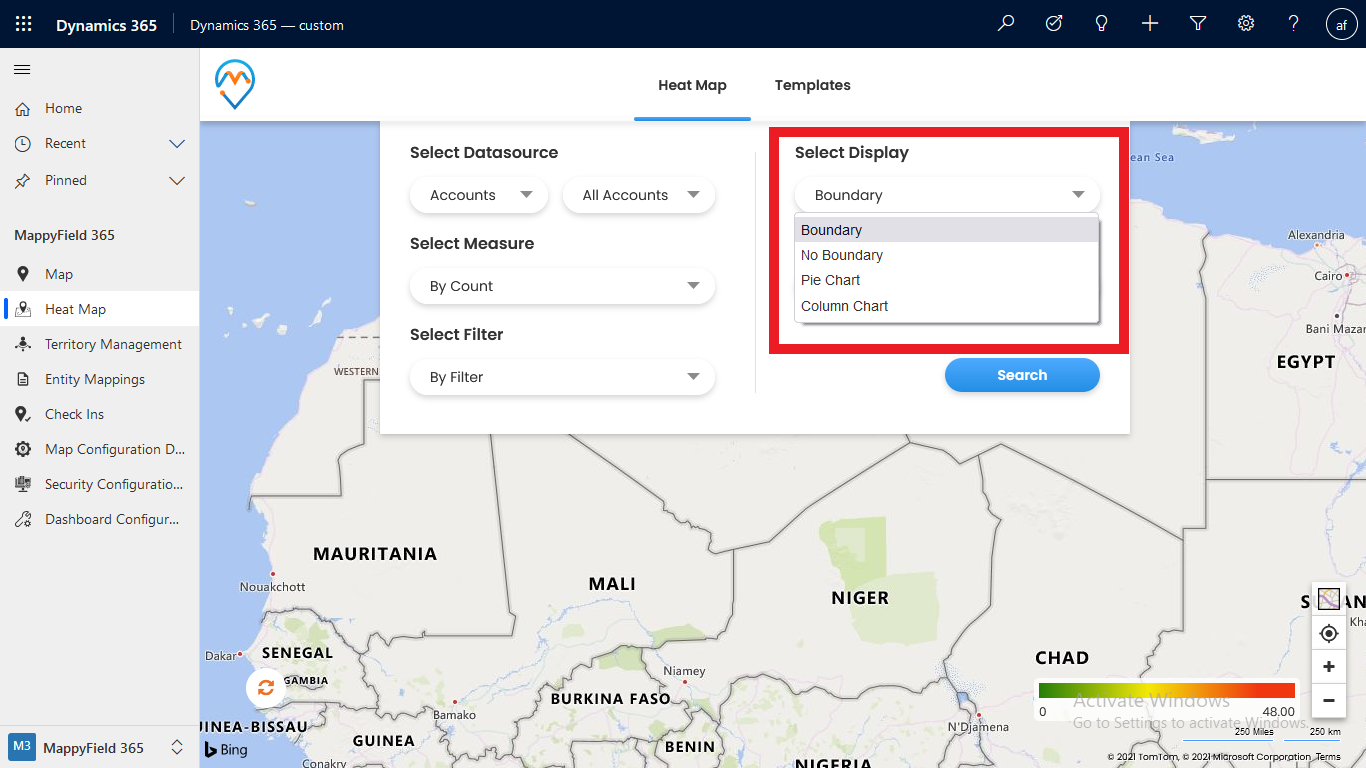
Step 3.4: Select the different types of display options. It will be for how you want to display the records on the map tab. Like boundary, pi chart, column chart. As per the selected option, it will plot records according to the display type.
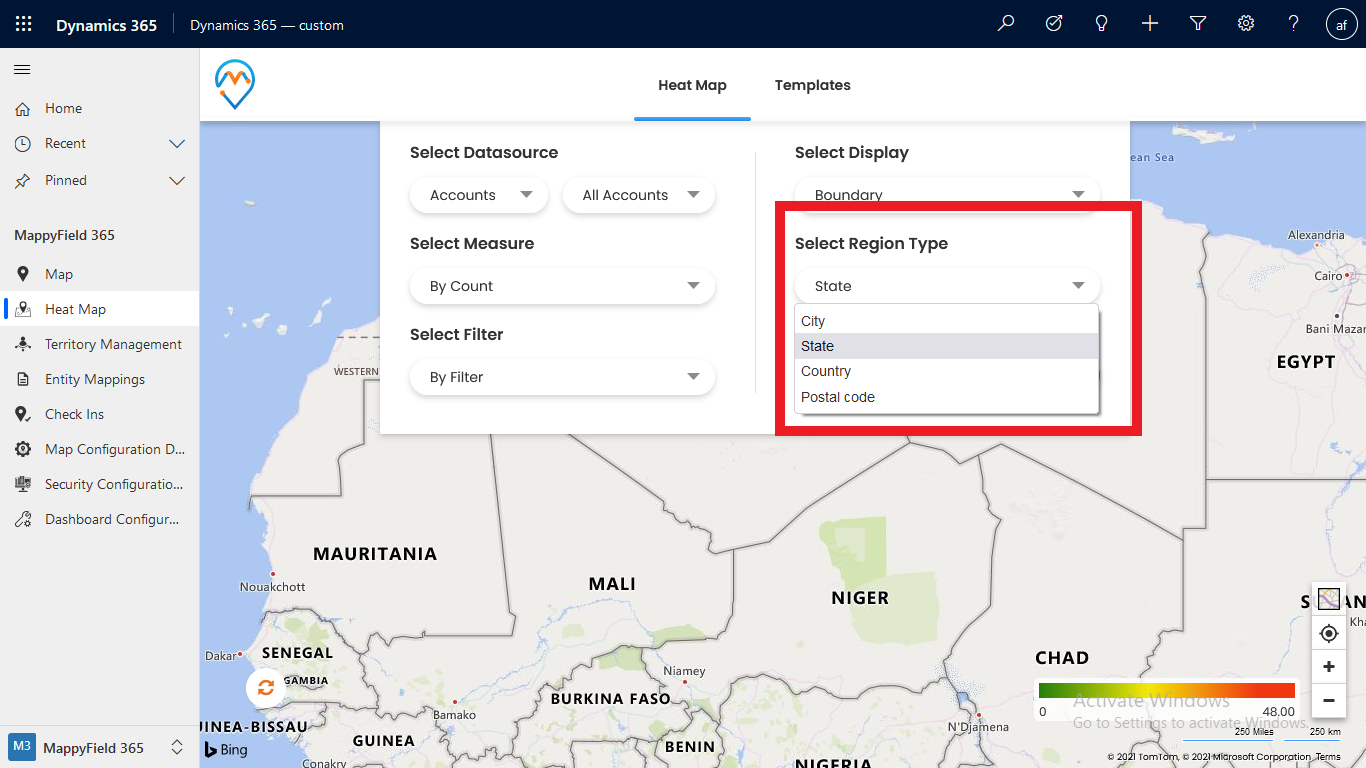
Step 3.5: After that, configure the region type by which you want to plot the records. Options like, by city, by state, etc.
Step 4: Click on the Search button to plot the records on the heat map tab.
Step 5: Click on the Save button to save the heat map template.
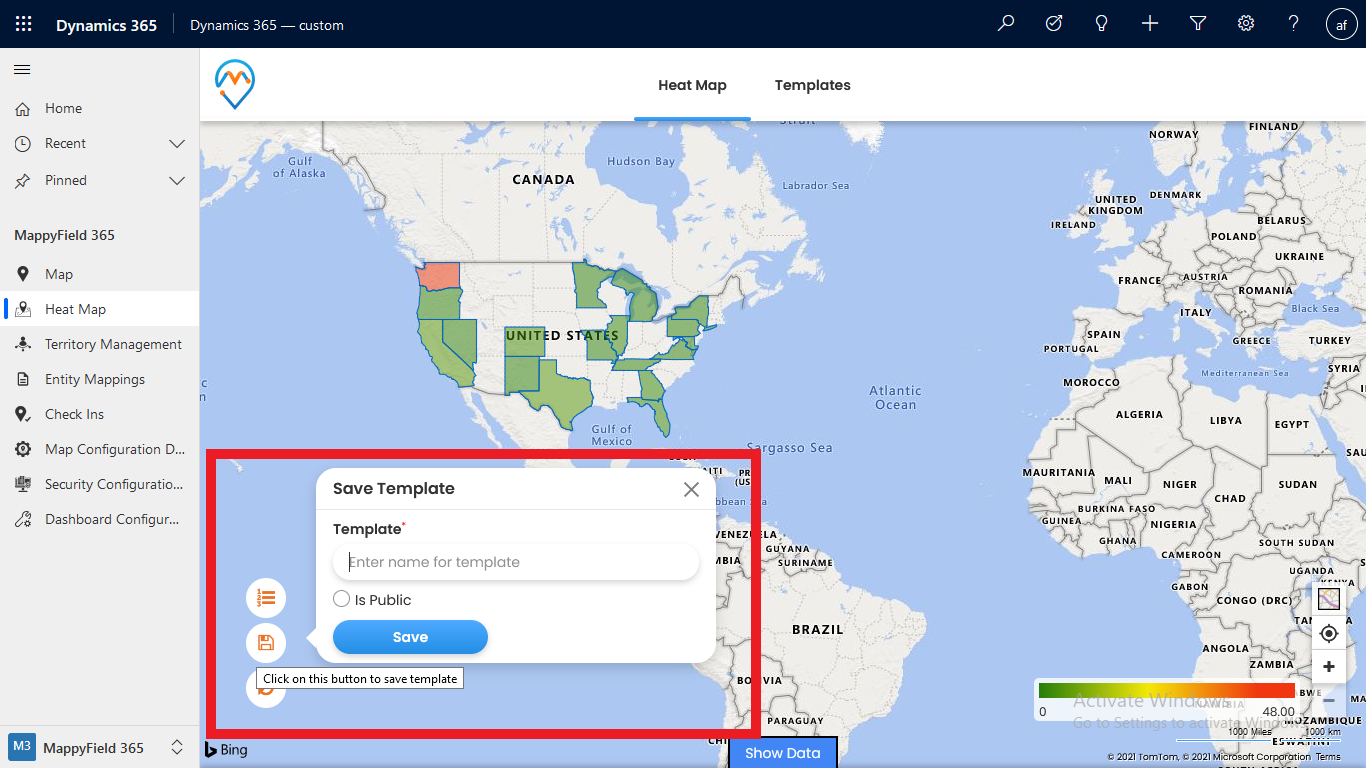
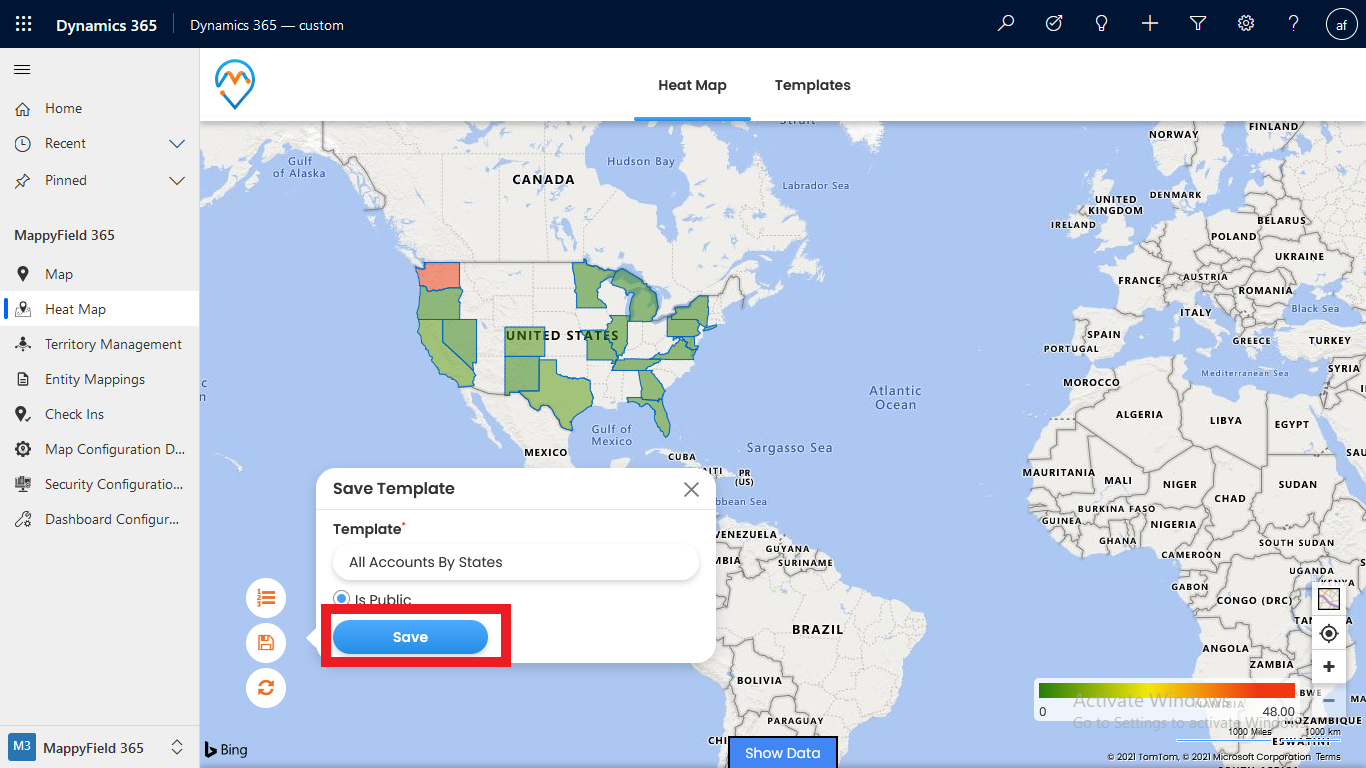
Step 6: Enter the Name of the template and select whether it is available for all or private.
Step 7: Click on the Save button to save the template.
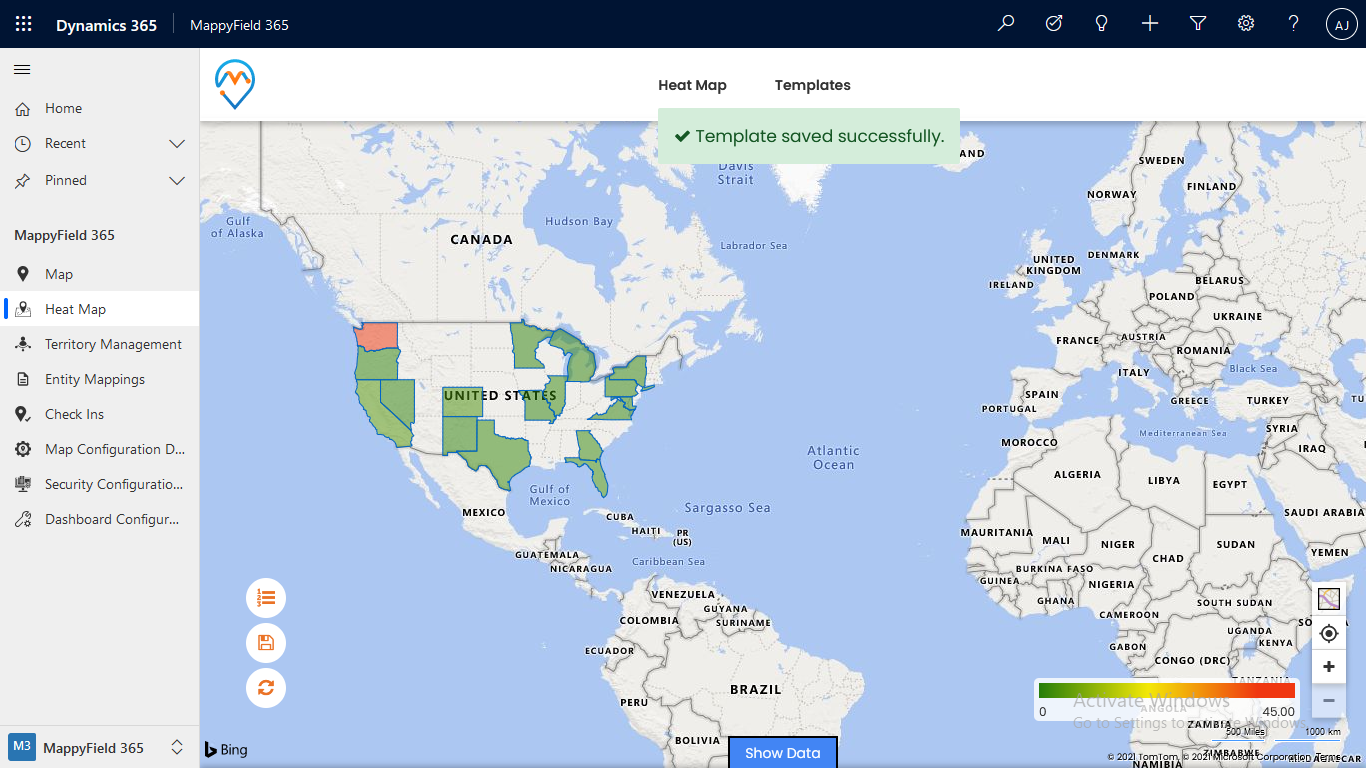
Step 8: Click on the Template tab available on the top. You can see the list of saved templates.
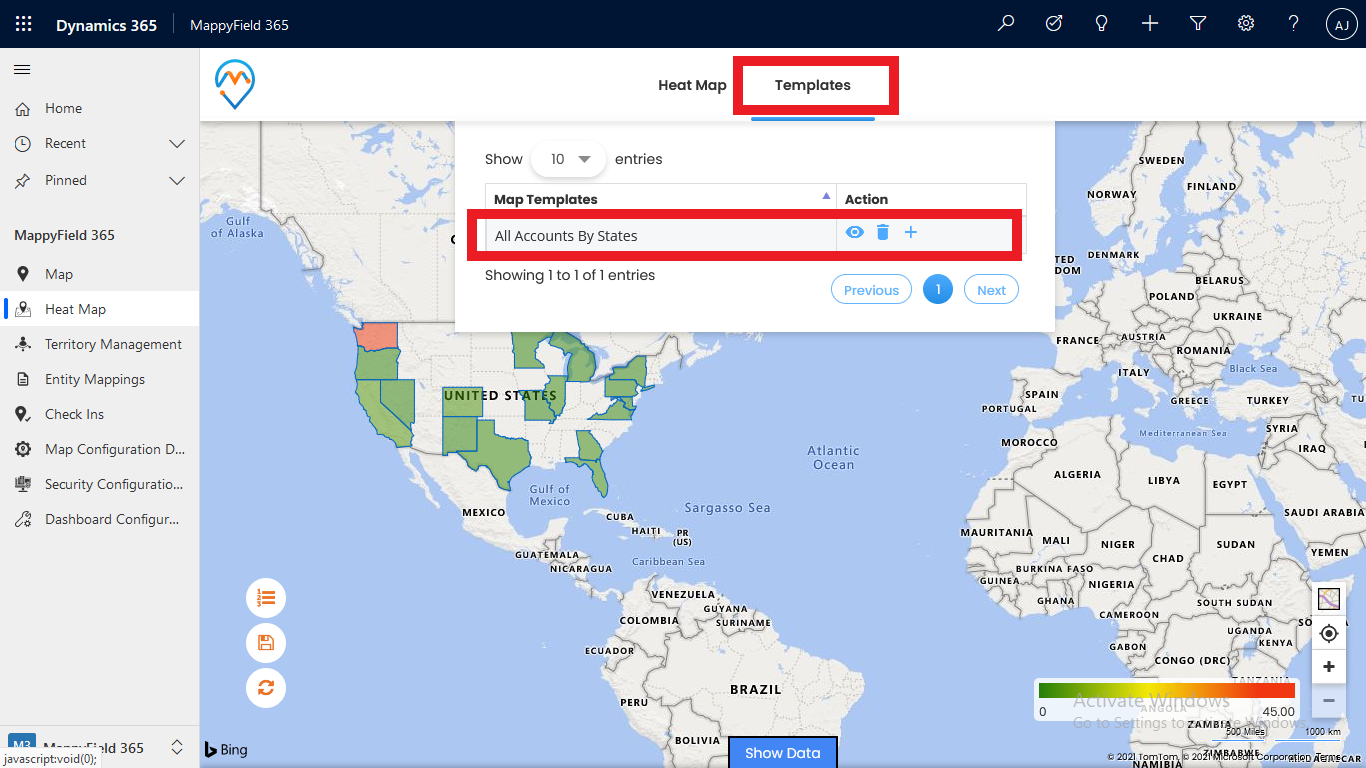
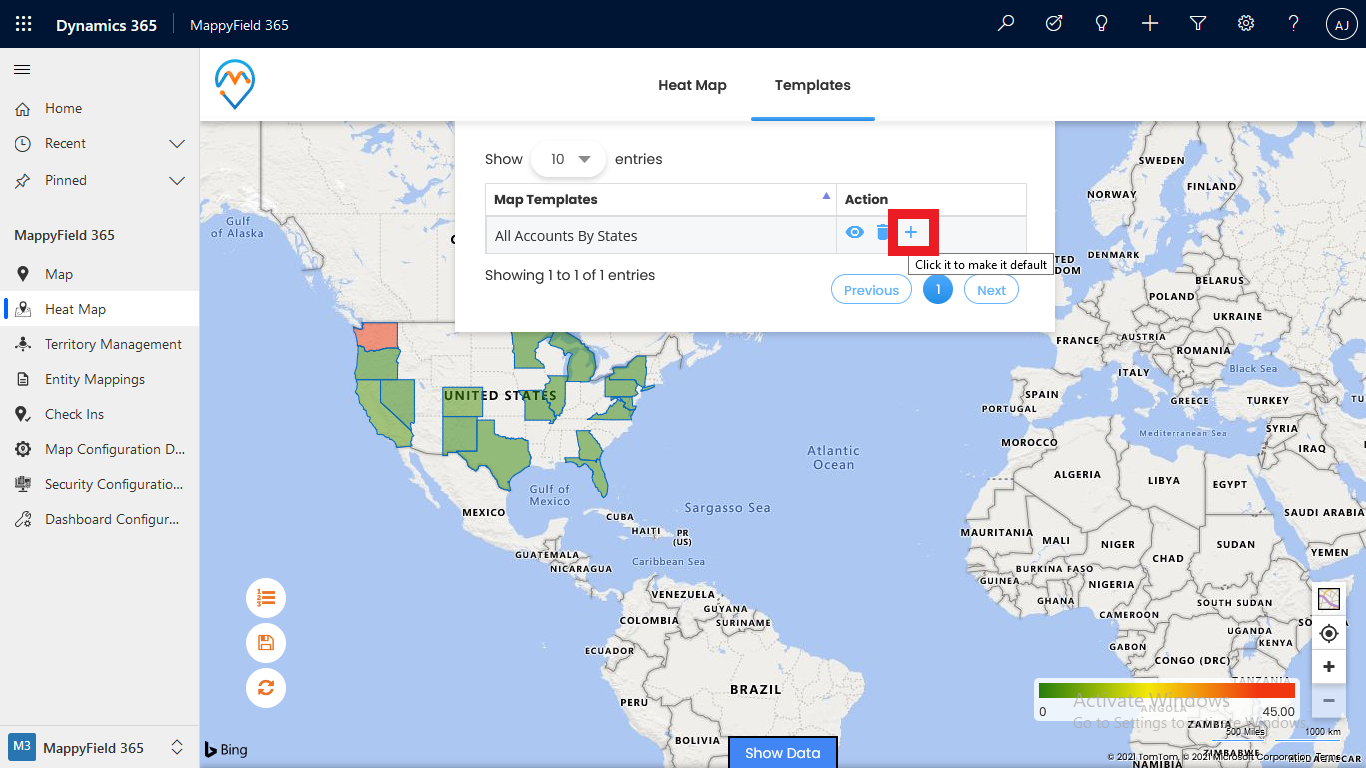
Step 9: Click on the Plus sign to make it the default template. Next time when you will refresh the page, it will load the default saved template.
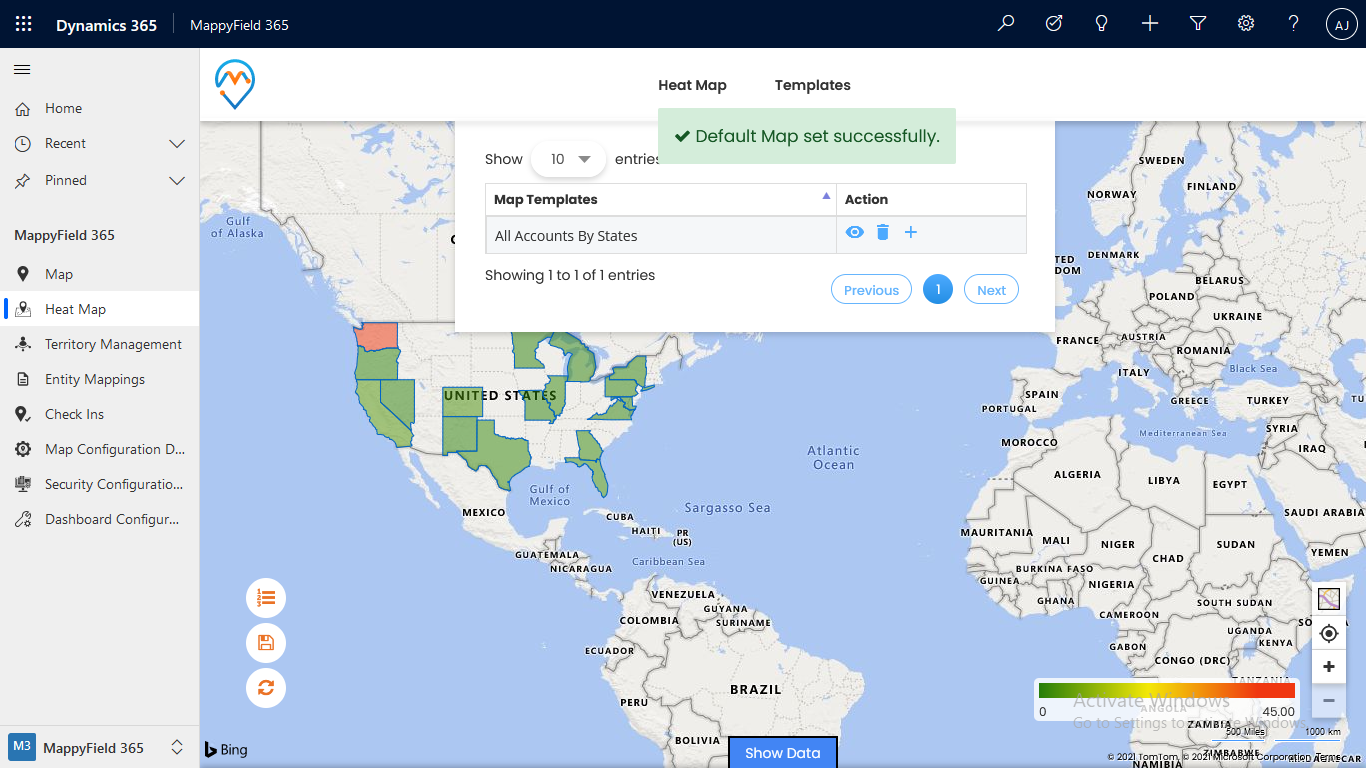
Step 10: Refresh the page and check the result.
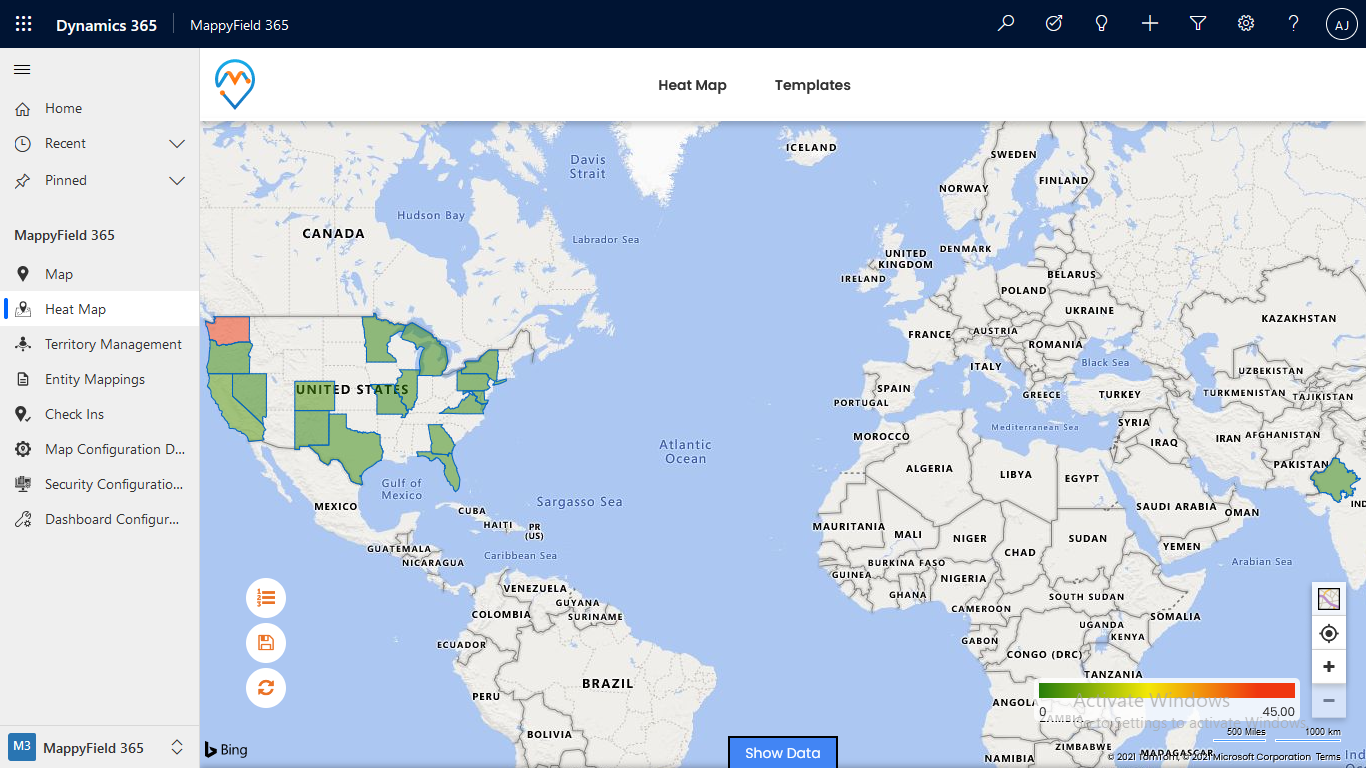
In this way, you can set the heatmap as the default one and check the performance whenever you want to.
If you want to know about any feature regarding AppJetty MappyField 365, feel free to reach out to us at [email protected] or you can just click on “Contact Us”.
All product and company names are trademarks™, registered® or copyright© trademarks of their respective holders. Use of them does not imply any affiliation with or endorsement by them.


