

The more scattered your data is, the harder it gets for you to understand and make any decisions. Moreover, to understand your current customer base as well as your opportunities and leads, it is imperative to have an overview of all your accounts, contacts, and leads.
So, in this blog, we are going to show all the Dynamics CRM users out there how to plot Entity Records on a map right from the CRM.
The Dynamics CRM itself provides this functionality of adding an Entity record on a map.
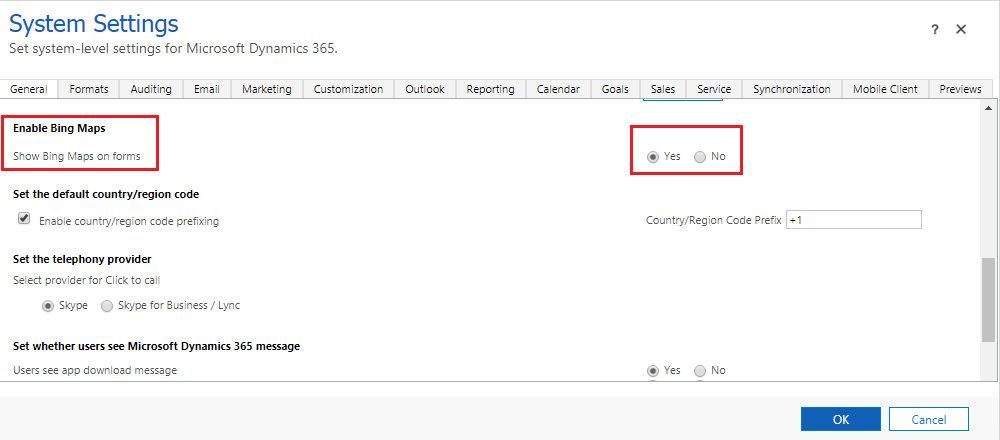
Step 1: Enabling Bing Maps
To enable Bing maps, go to the Settings → Administration → System Settings. By default, the General tab will open. Scroll down to the “Enable Bing Maps” option and select the “Yes” option to enable the Bing Map.
Press OK to save the changes.
Step 2: Plotting entity records on the map
Step 2: Plotting records
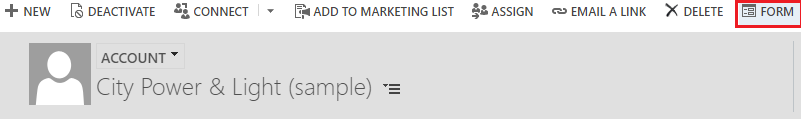
After enabling Bing maps, go to any entity record and edit it. Find the ‘Form’ or ‘Form edit’ option.
By clicking on it, the PowerApps tab will open. Select the Bing maps from the ‘Insert’ tab.
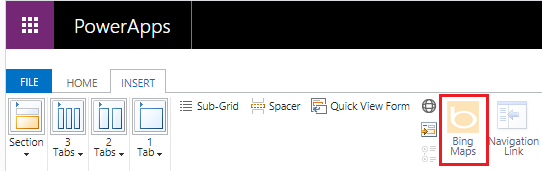
After clicking on Bing Maps, a pop-up will appear where you need to insert and select the required details.
Save the changes and click on publish.
Now, you’ll be able to see the plotted account on the map inside of that account as shown in the below image.
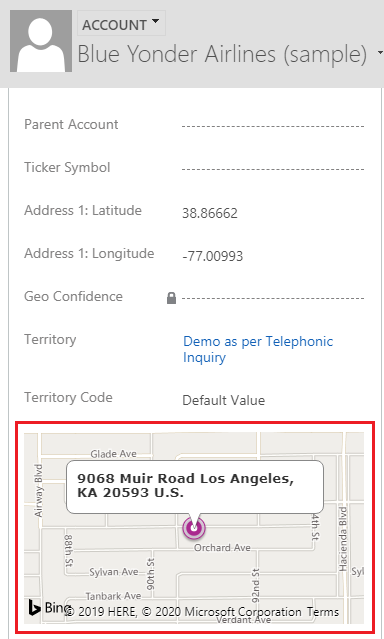
With Dynamics default functionality, you cannot view multiple records on a map at the same time. You only get to see one record on the map.
To see all your active accounts or all accounts or any other entity records on the map, you can opt for any Dynamics CRM Map integration from MS AppSource.
One such microsoft dynamics crm mapping Integration is ‘MappyField 365’ using which you can display all the Dynamics CRM records on the map with the required details.
Other tasks that you can perform using MappyField 365 are:
– You can plot and see the records of the selected entity geographically.
– By selecting the multiple entities, you can save your own view (template) also.
To plot records of any entity like accounts, contacts, leads, etc., follow the below steps:
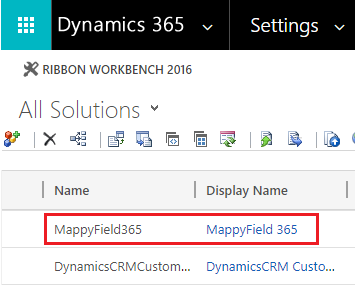
Step 3: Import the package of MappyField 365 and install it.
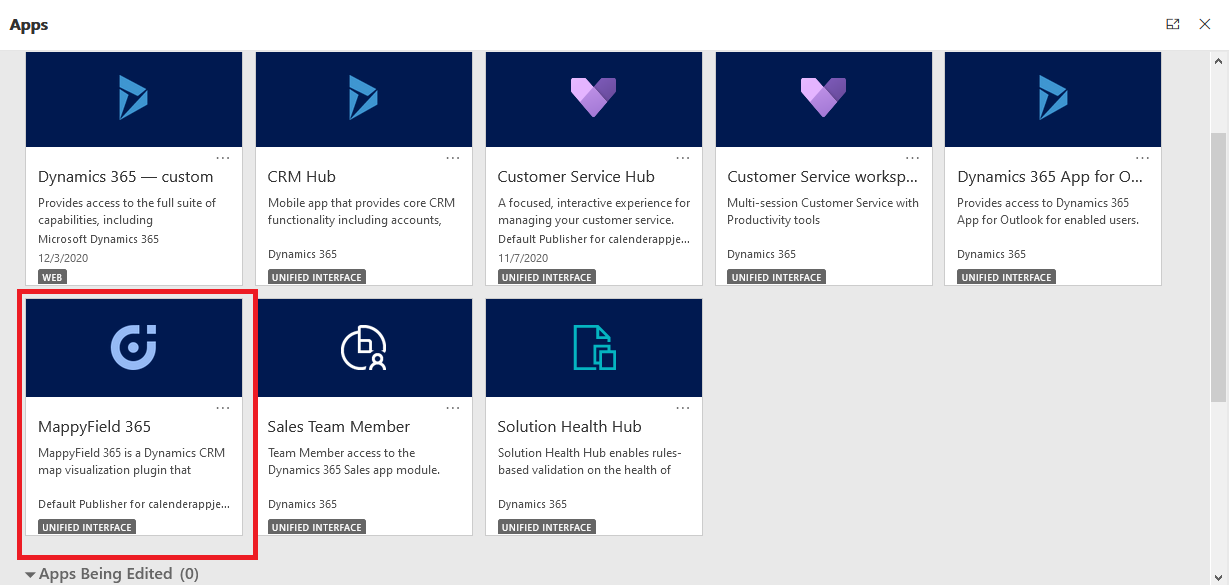
Step 4: Navigate to “MappyField” from the apps menu.
After logging into Dynamics 365, click on “MappyField 365” from the Dynamics 365 apps dashboard.
Step 5: Click on Entity Mappings
Navigate to the Entity Mapping to configure the entity details that will display on the map.
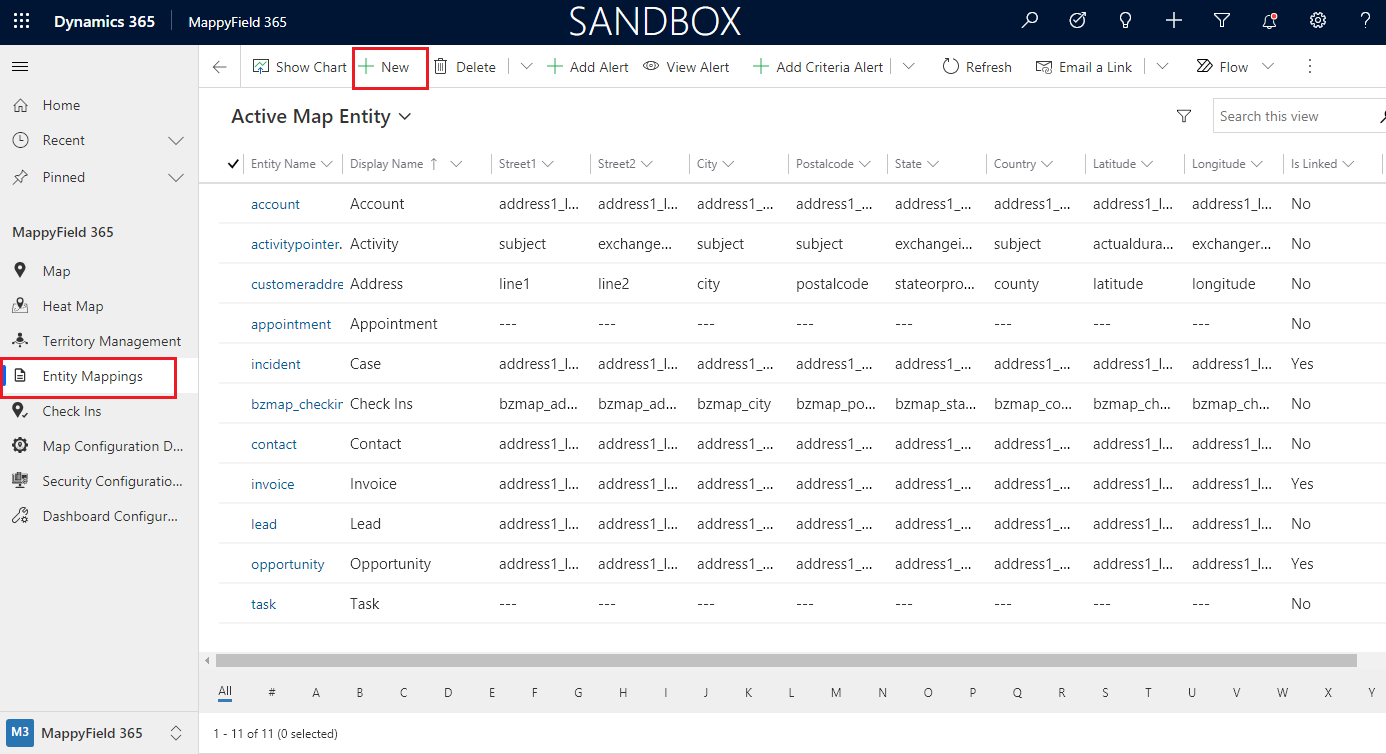
→ Click on the “New” button to add and configure a new entity.
→ Now, select an entity from the “Entity Name” dropdown and configure address fields for the selected entity.
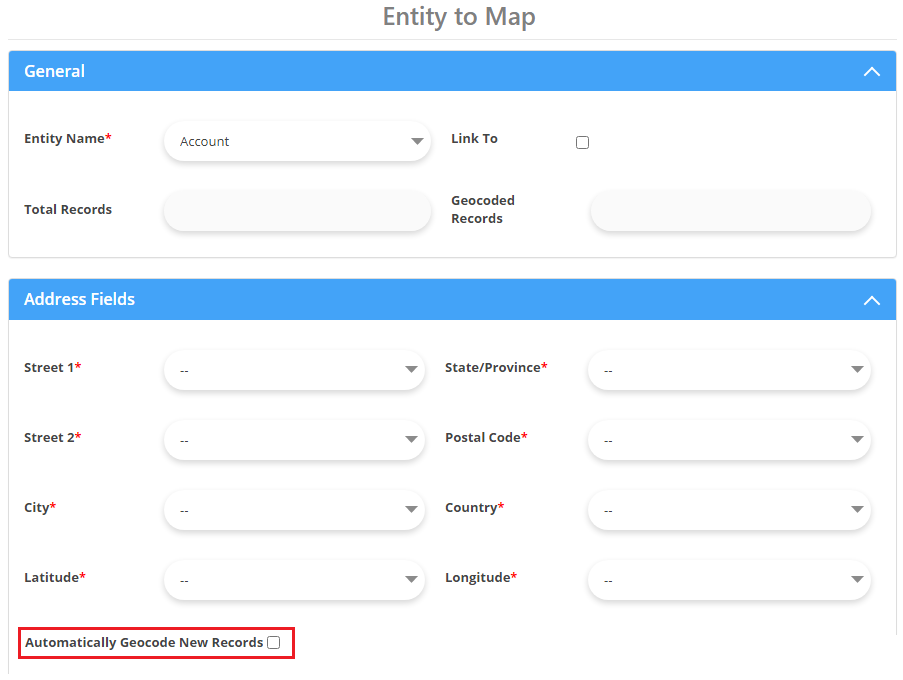
→ Check the checkbox “Automatically Geocode New Records” to automatically get geocodes when any new records for configured entities get created.
→ Click on the Save button to save entity configurations.
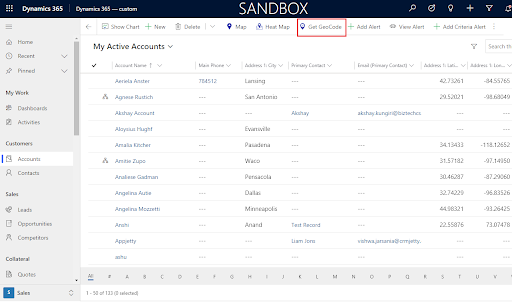
Step 6: Get Geocodes for entity records
→ To get geocode for records redirected to a particular entity. If you want to get geocode only for selected records, select those records and click on the “Get Geocode” button.
→ If you want to get geocode for all the records, click on the “Get Geocode” button. It will ask you for confirmation to get a geocode for all the records for the selected entity.
Step 7: Plot records on MappyField 365 map
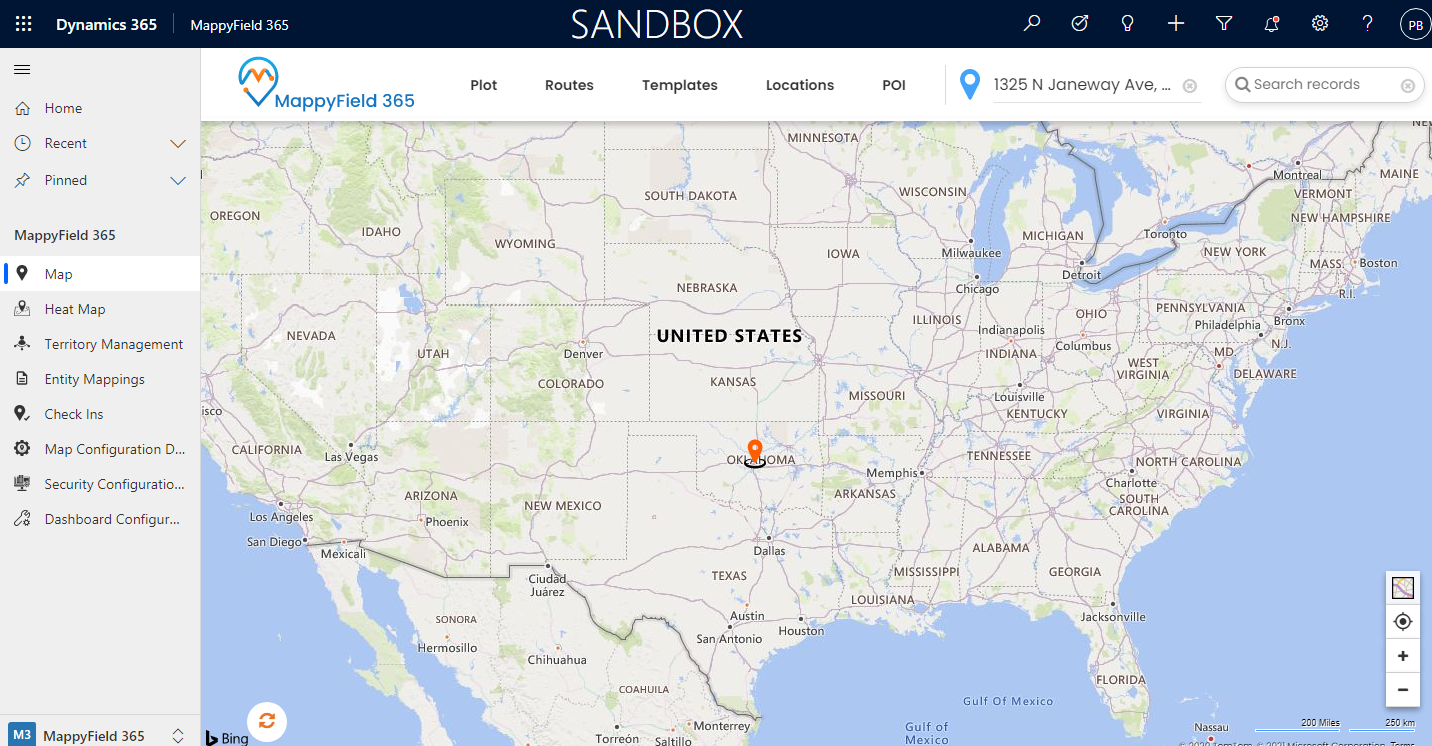
→ Navigate to MappyField 365 → Maps to plot the records of the configured entity.

→ By clicking on Map, the Map view will be loaded as per the default location configurations set by the admin.
→ Under the Plot Records, select the Entity from the “Select Entity” drop-down to plot the records on the map.
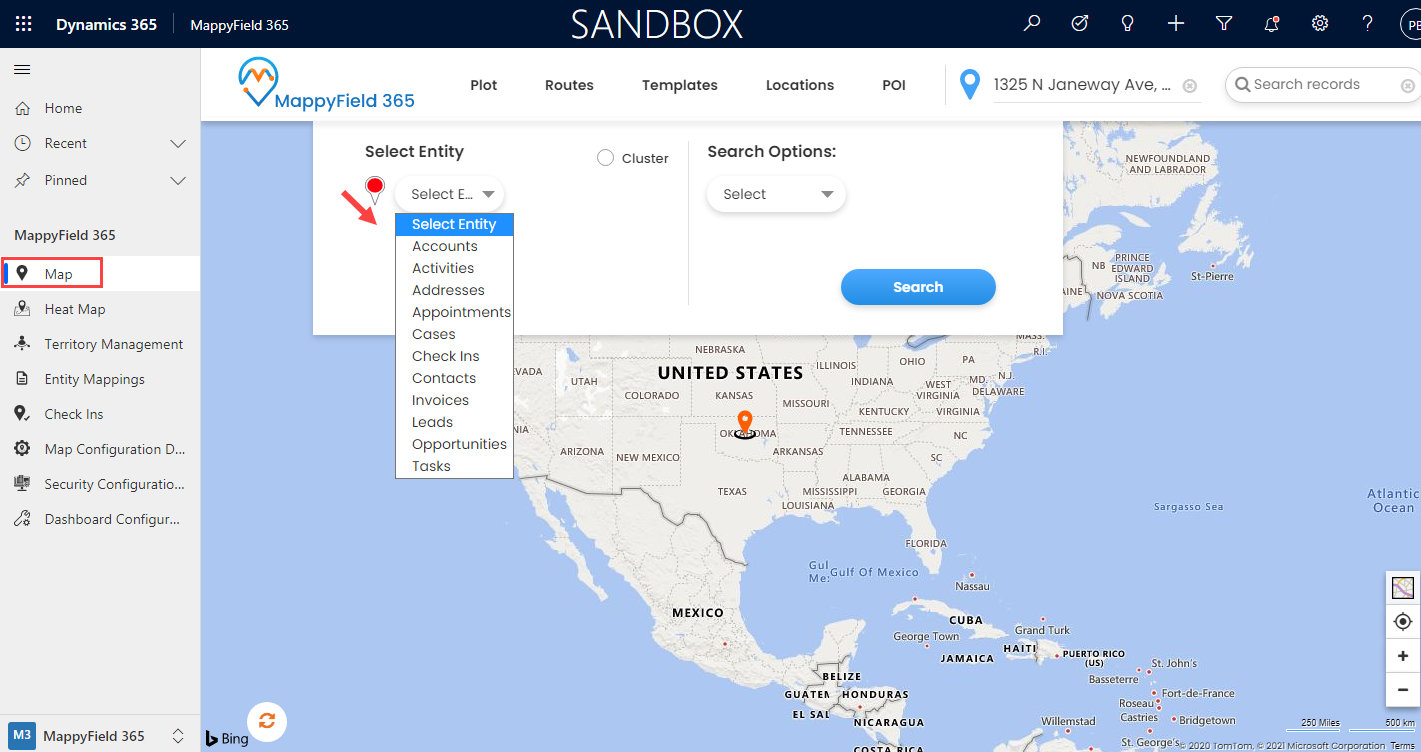
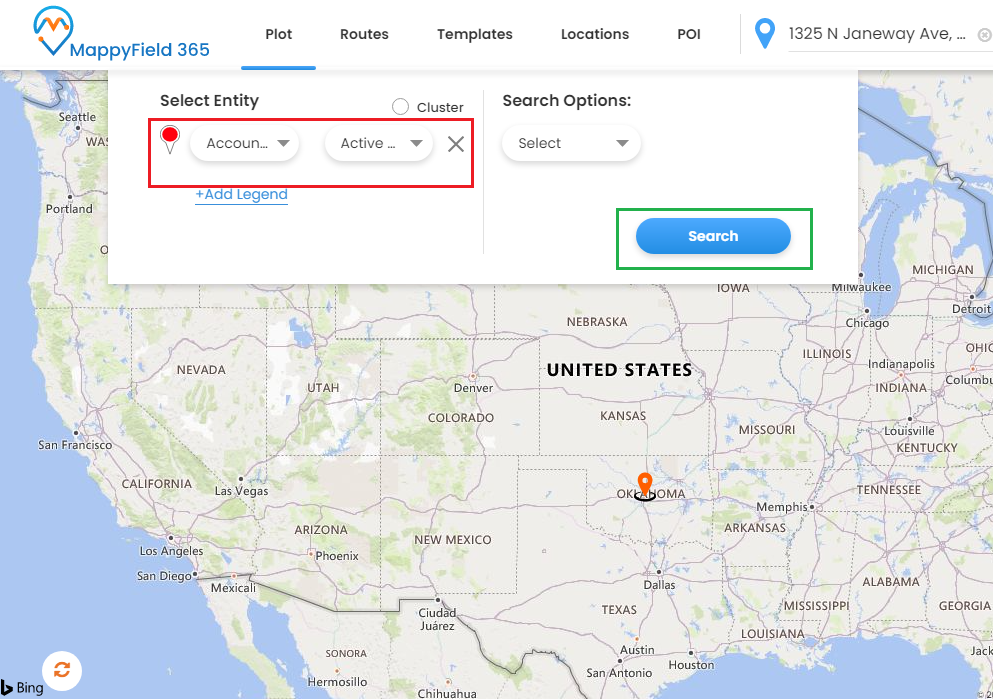
→ Based on the selection of an Entity and other related options, the entity records will be displayed on the map. If “Accounts” is selected, select its attribute which you want to plot on the map in the view options besides entity. Select “View” for Accounts like all accounts, my active accounts, inactive accounts, etc.
→ The account details can be seen by clicking on a Pin icon.
→ Check the record details by moving the mouse on the pushpin icon.
→ Plotting the records for multiple entities is also possible in MappyField 365. Click on the ‘+Add Legend’ text to add multiple entities. Select the entity and its record view options besides the entity.
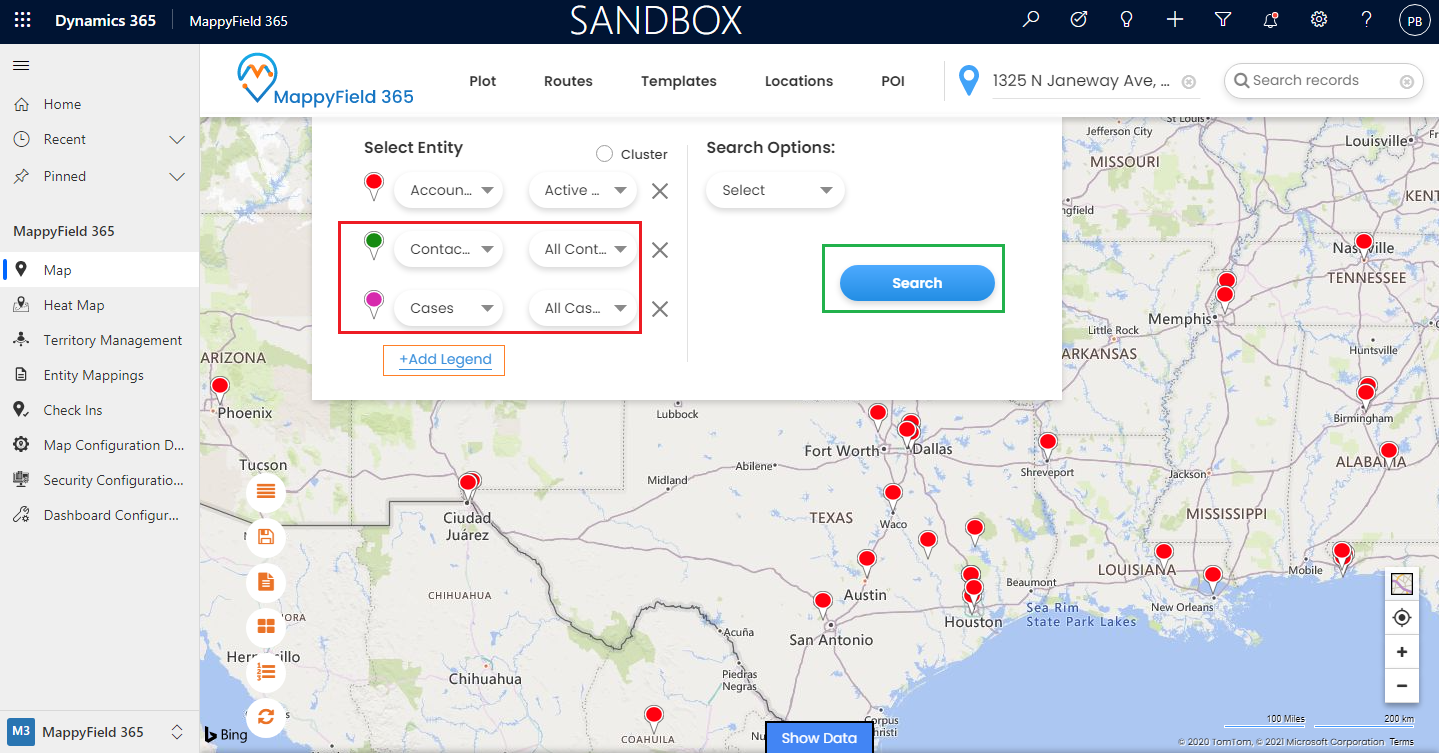
→ By clicking on the Search button, the selected entity with the record view will be plotted on the map.
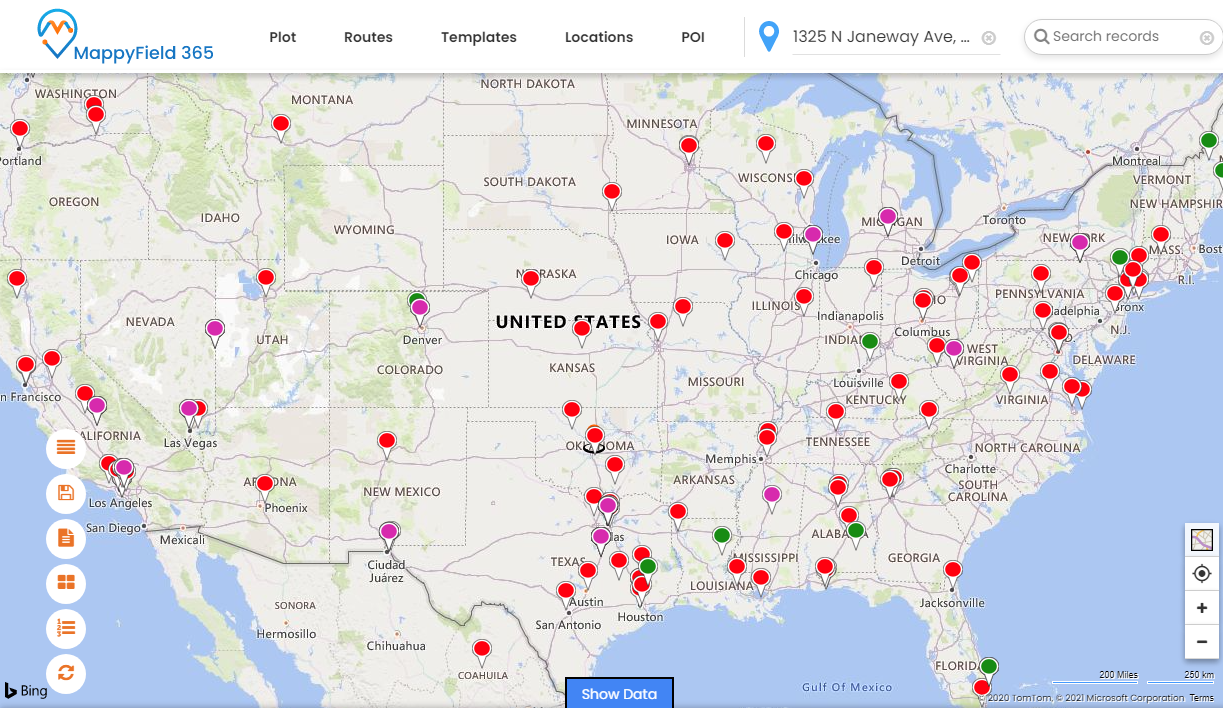
In this way, you can add and configure the entities to plot the CRM records on the map using Dynamics Map Integration, MappyField365. You will get the geographical view of all the CRM records.
All product and company names are trademarks™, registered® or copyright© trademarks of their respective holders. Use of them does not imply any affiliation with or endorsement by them.


