

To find the correlation and causality of a particular change in data, you need to see it in relation to other data sets.
And what better and efficient way to do so by plotting multiple entities or data sets on the map.
So, in this blog, we are going to demonstrate how to plot multiple entities on the map using Dynamics 365 map integration. Additionally, we’ll also show how to categorize the plotted records.
For demonstration purposes, we are using MappyField 365. There are many other mapping tools available on MS AppSource that natively connects with your Dynamics 365.
In the MappyField 365, you can easily plot the multiple records and views on the map. The purpose of this feature is to show multiple entities’ data on a single map with the help of the layer menu that enables you to show/hide a particular layer(s).
You need to follow the below steps to get the categorized data on the map:
– Plot the entity records
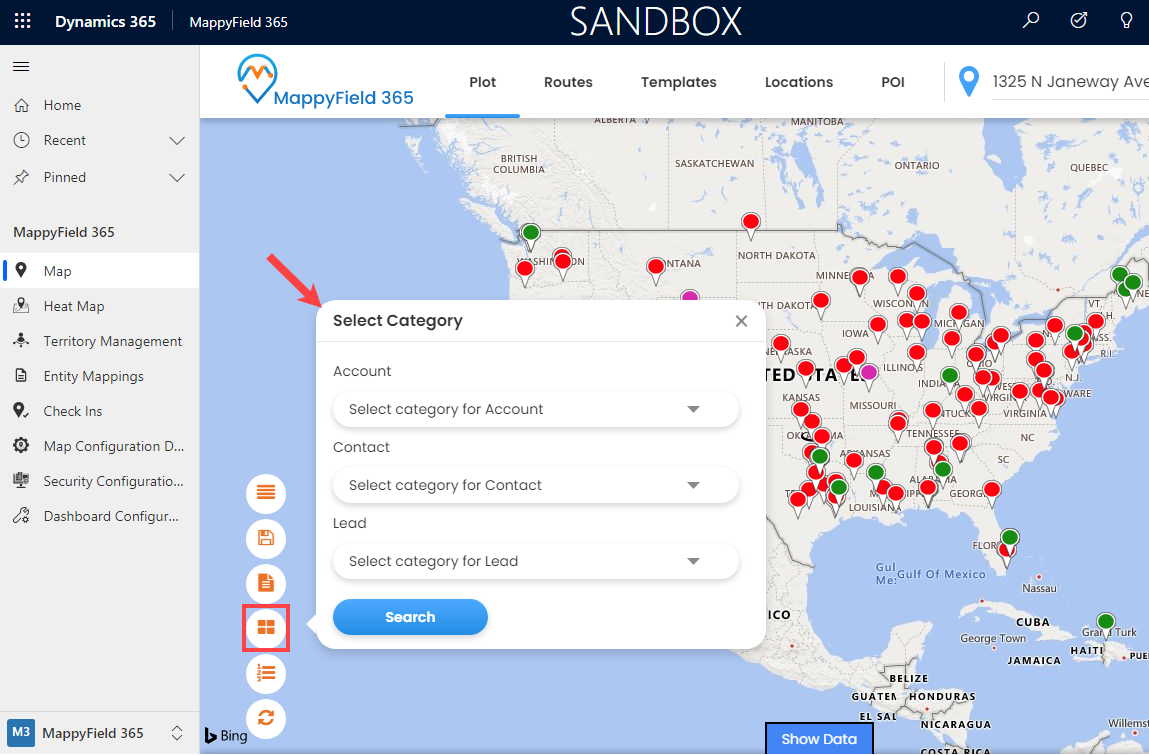
– Open the Category card option from the advanced options
– Select the category attribute of the entity individually
– View and analyse the categorized data on the map
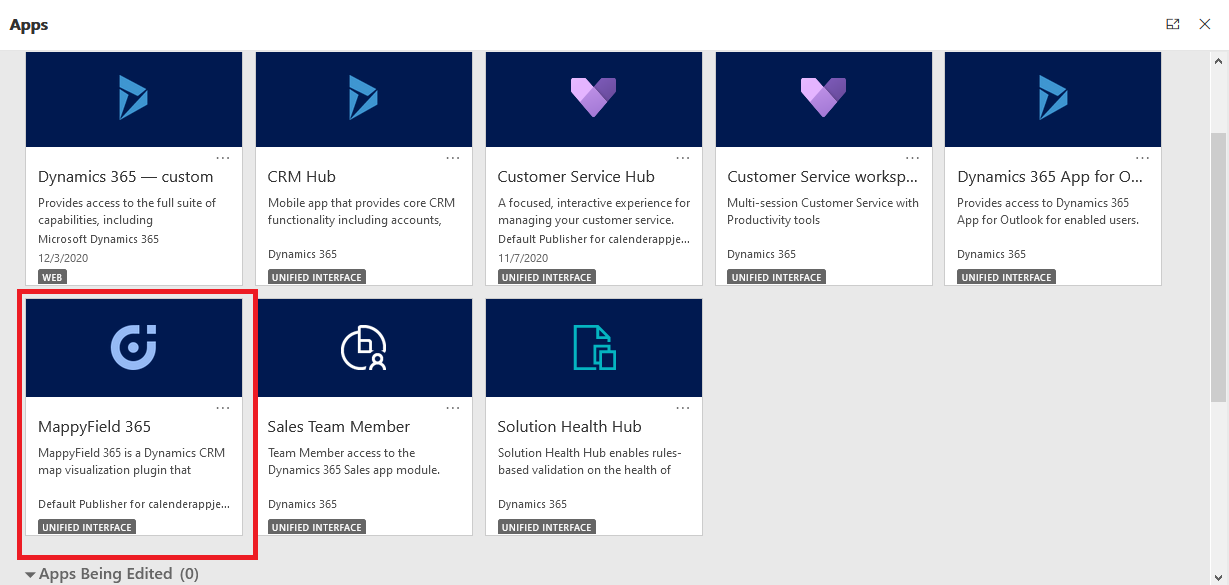
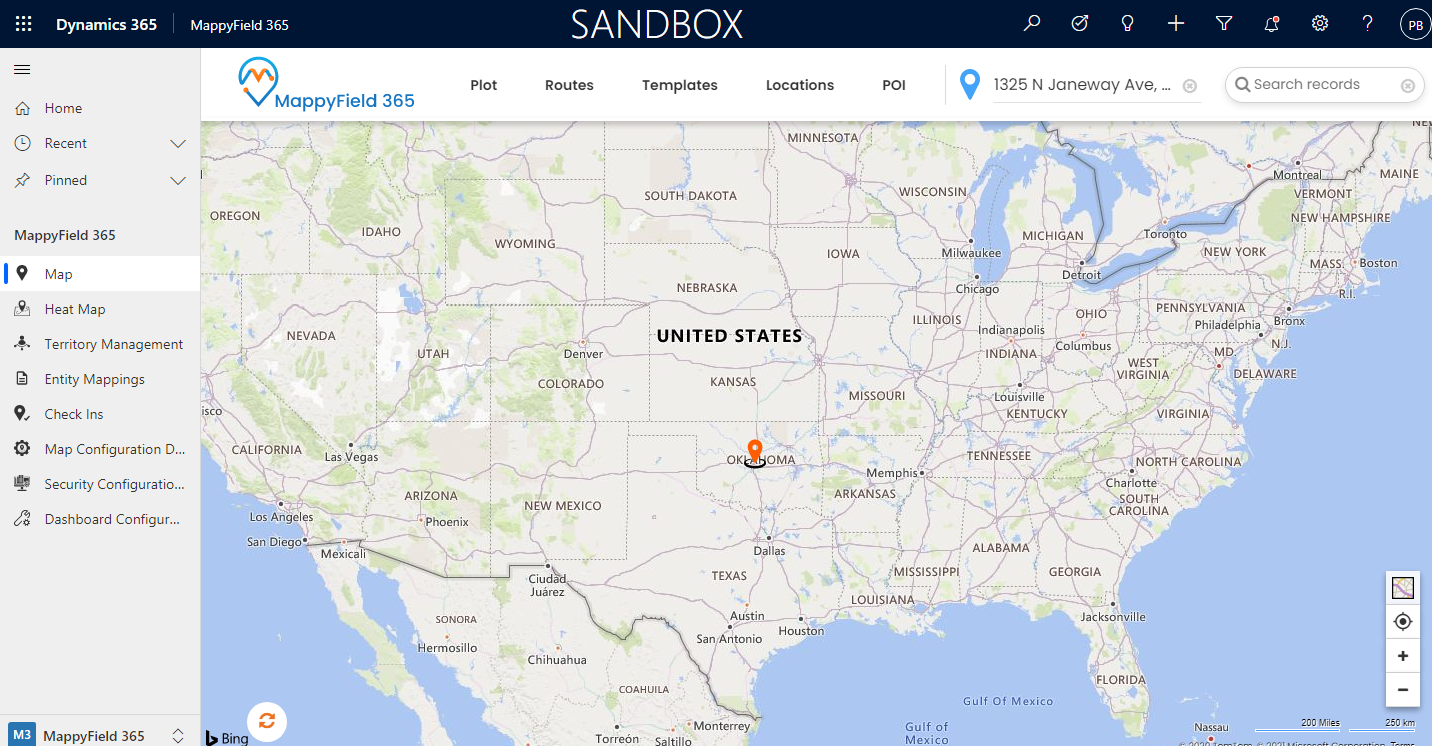
Step 1: Navigate to MappyField 365
After logging into Dynamics 365, click on “MappyField 365” from the Dynamics 365 apps dashboard.
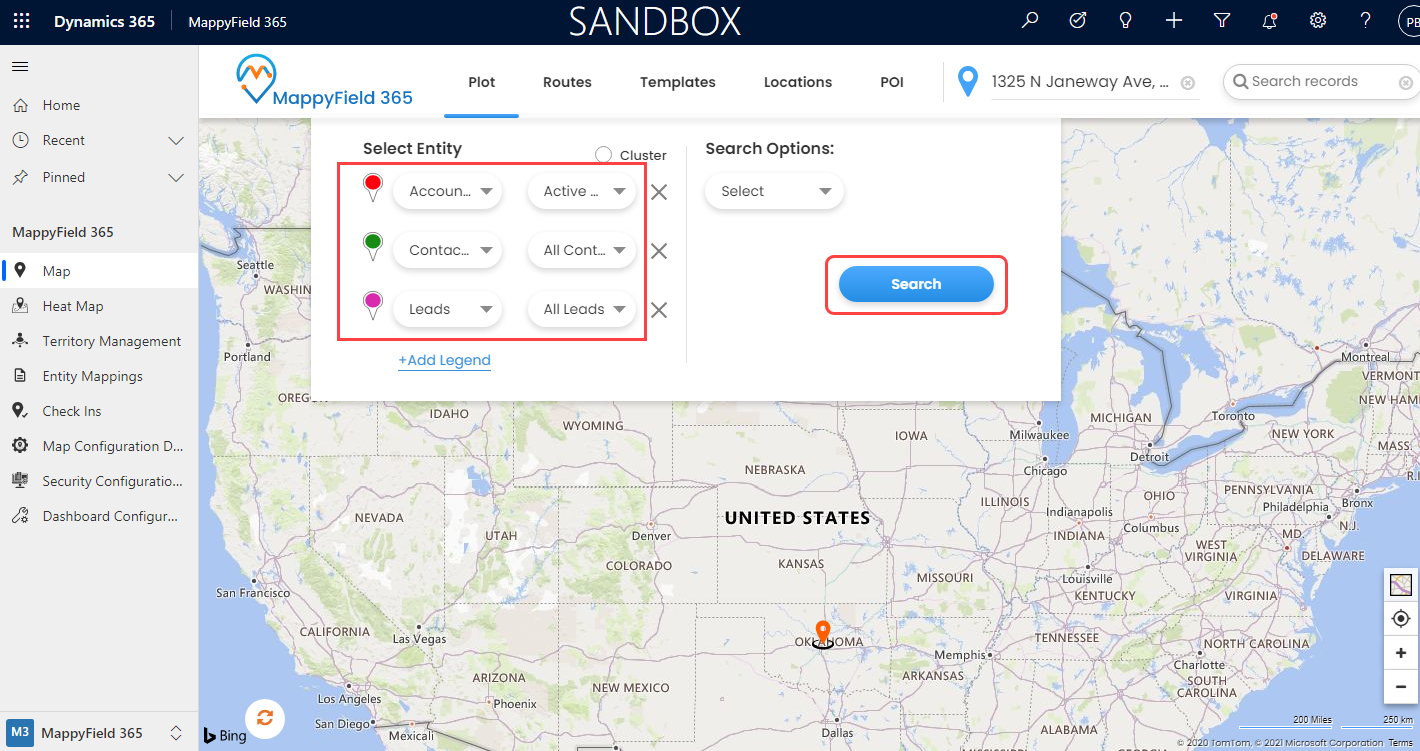
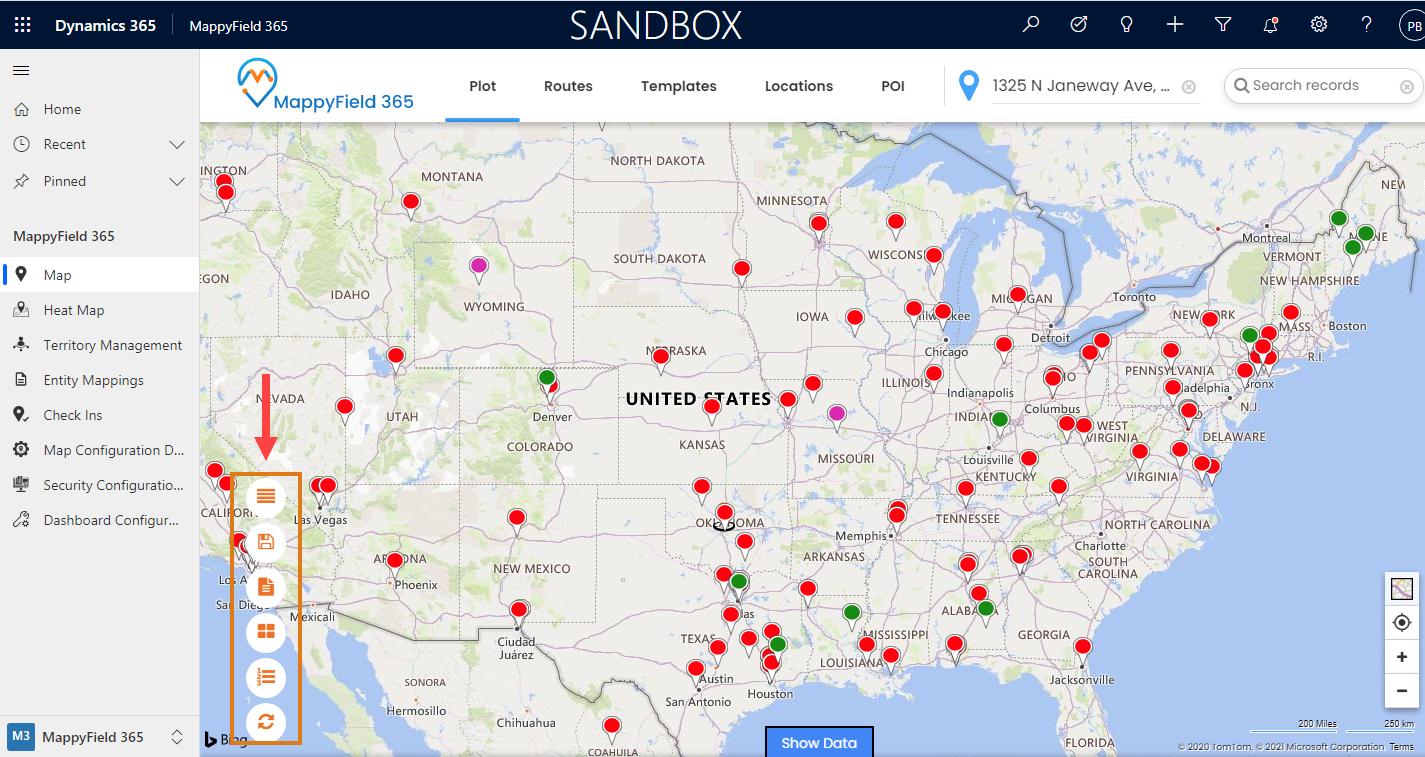
Step 2: Plot records on MappyField 365 map
Now, plot the records on the map by selecting the CRM entities that are configured from Entity mappings. Under the Plot tab, select the Entity and its Records view.
Step 3: Categorize the plotted data
If you want some categorized data based on specific details of the plotted records (i.e. City, State, Annual Revenue, etc.), you can use the Category option from ‘advanced option’.
Note: You can plot a maximum of five entities at a time. So, you can select categories for five entities and plot categorized data by selecting a specific category field on the map.
Select the category for the entities individually.
< Entity: Category >
Account: Annual Revenue
Contact: Address 1: State/Province
Lead: Type
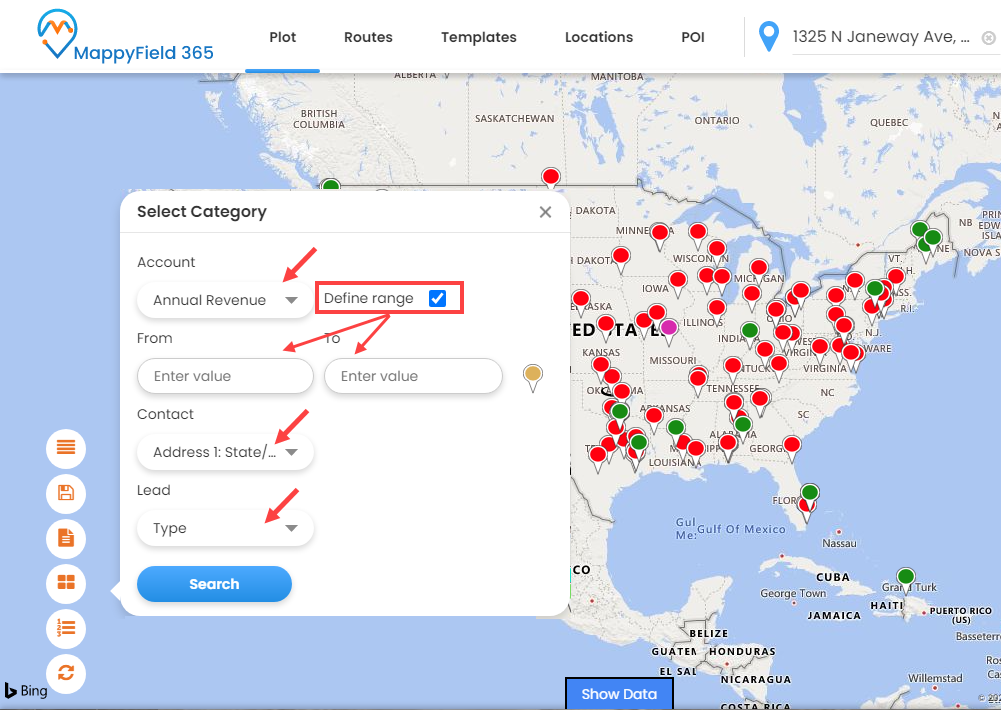
i.e. For the Account entity, the ‘Annual Revenue’ is selected. So you can define the range of the annual revenue.
Now after selecting the categories for the entity and inserting some details, click on the ‘Search’ button to plot the categorized data for the entities.
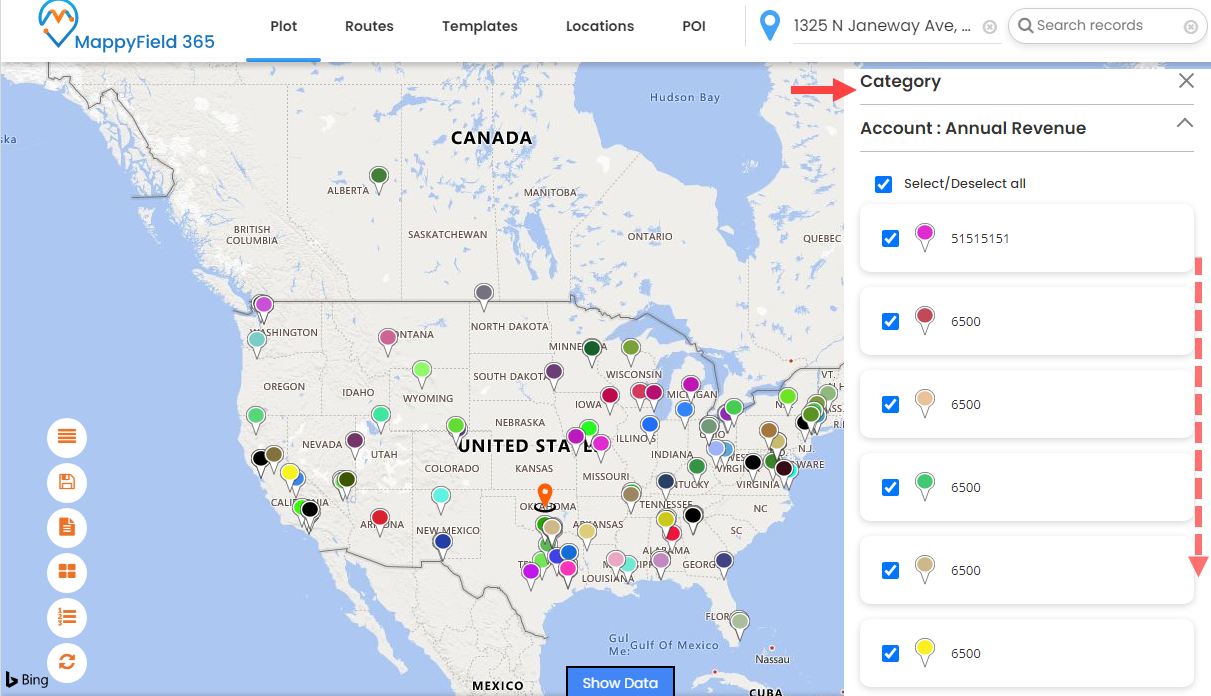
Hence, you can make the most of your data by smartly plotting and categorizing it using a Dynamics 365 mapping tool.
All product and company names are trademarks™, registered® or copyright© trademarks of their respective holders. Use of them does not imply any affiliation with or endorsement by them.


