

If you are in the managing role for the Sales/Marketing activities, you must need to manage the activities and sales reps/field executives. You need to assign the area-wise sales reps and activities to achieve the sales target. Microsoft Dynamics 365 provides the geographic view of the CRM records that can be displayed on the Dynamics 365 maps. You can improve sales potential and revenues by creating territories for the sales activities and market segments in Dynamics CRM/365.
Using the Dynamics 365/CRM default maps, you can track the CRM records on the map, but only for the individual entities. You need to configure many backend options of the Dynamics CRM to get the entities and activities on the Dynamics CRM map.
AppJetty MappyField 365 is a Dynamics CRM Map integration plugin that helps to plot your CRM data on the map. Using MappyField 365, CRM users can get detailed information about their market geography and prospect locations.
MappyField 365 provides the “Territory Management” to create and manage the territories from the map itself. Using Territory Management, you can easily manage the sales/marketing activities by defining the areas/regions from the Territory map. You can also insert the territory records in the map area by importing a CSV file with the specific format. You can easily assign the territories to the relevant team members (Sales Reps) right from the map.
In this blog, we will explain how to plot the territories using the CSV file with a specific format.
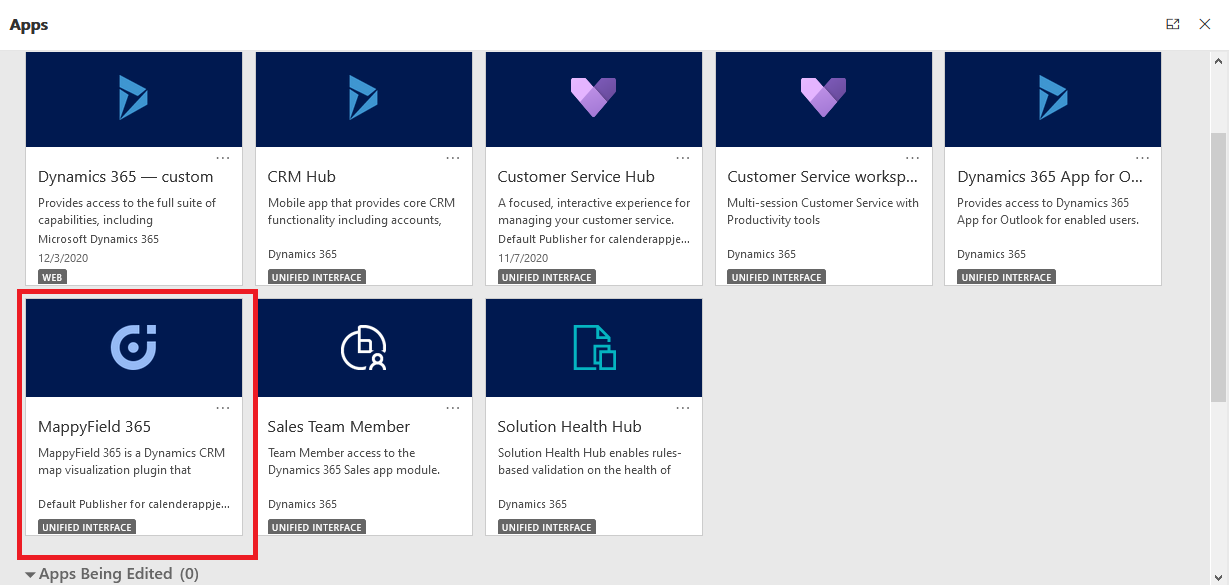
Step 1: Navigate to MappyField 365
Select “MappyField 365” from the Dynamics 365 dashboard or app list.
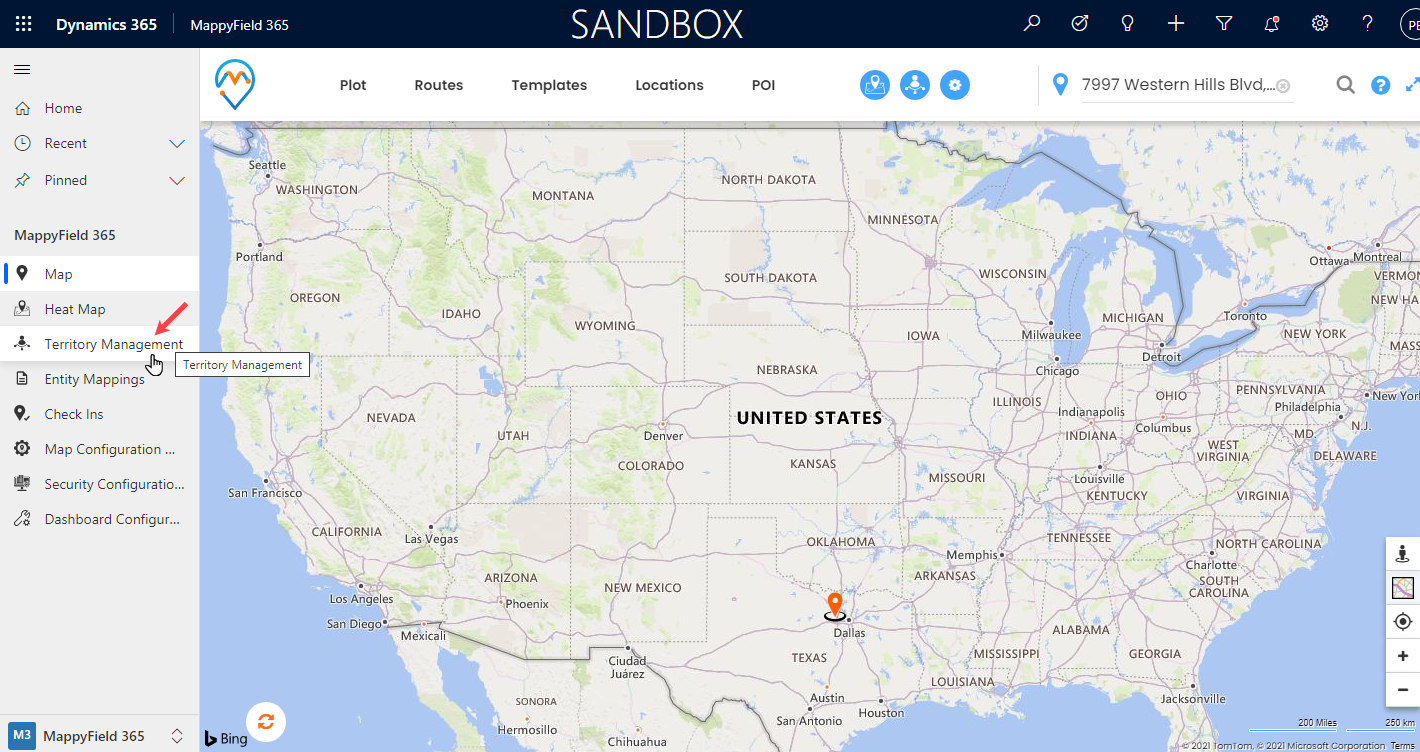
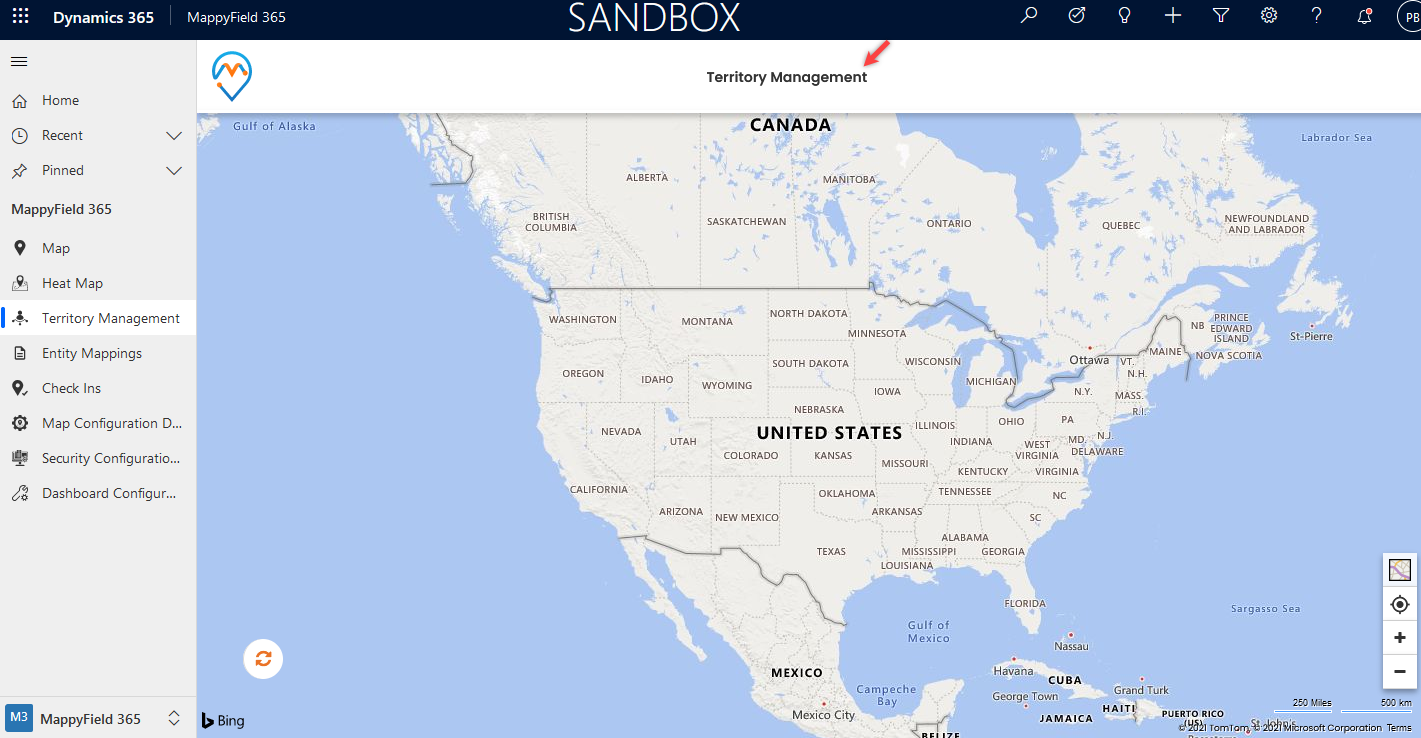
Step 2: Navigate to Territory Management
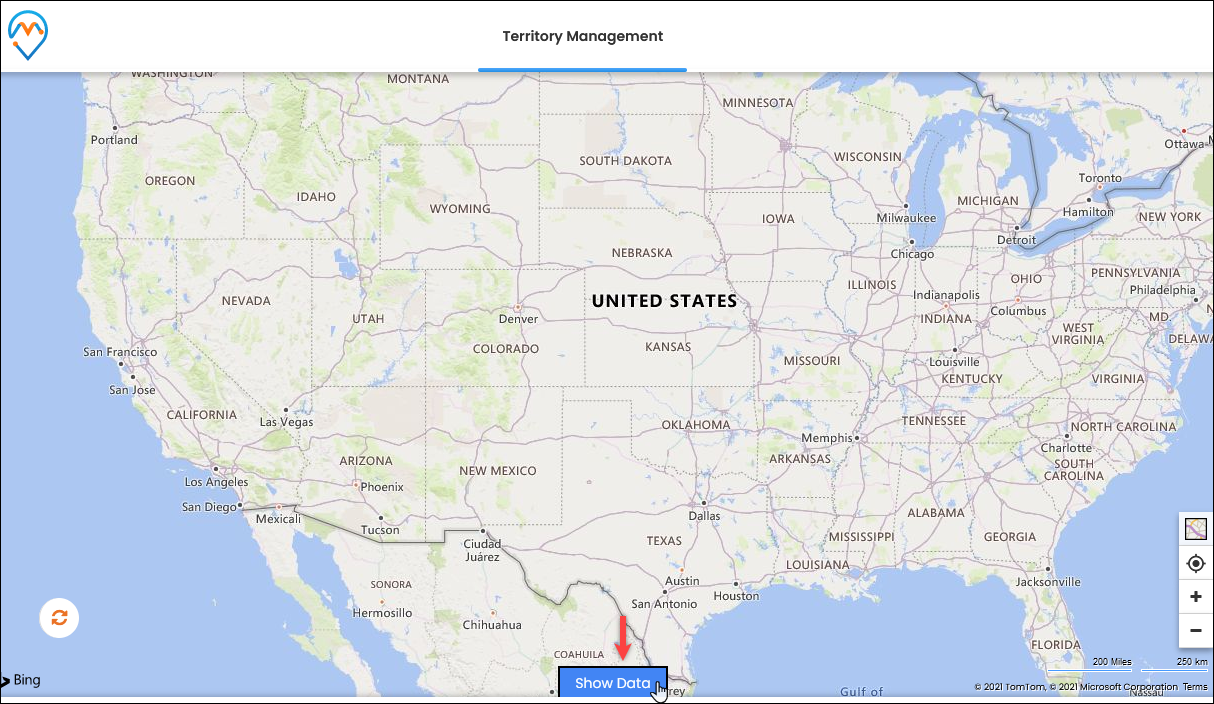
By clicking on the “Territory Management”, you will be navigated to the Territory Management map. From here, you can manage your sales areas as territories and assign the required Team Members (Salesperson).
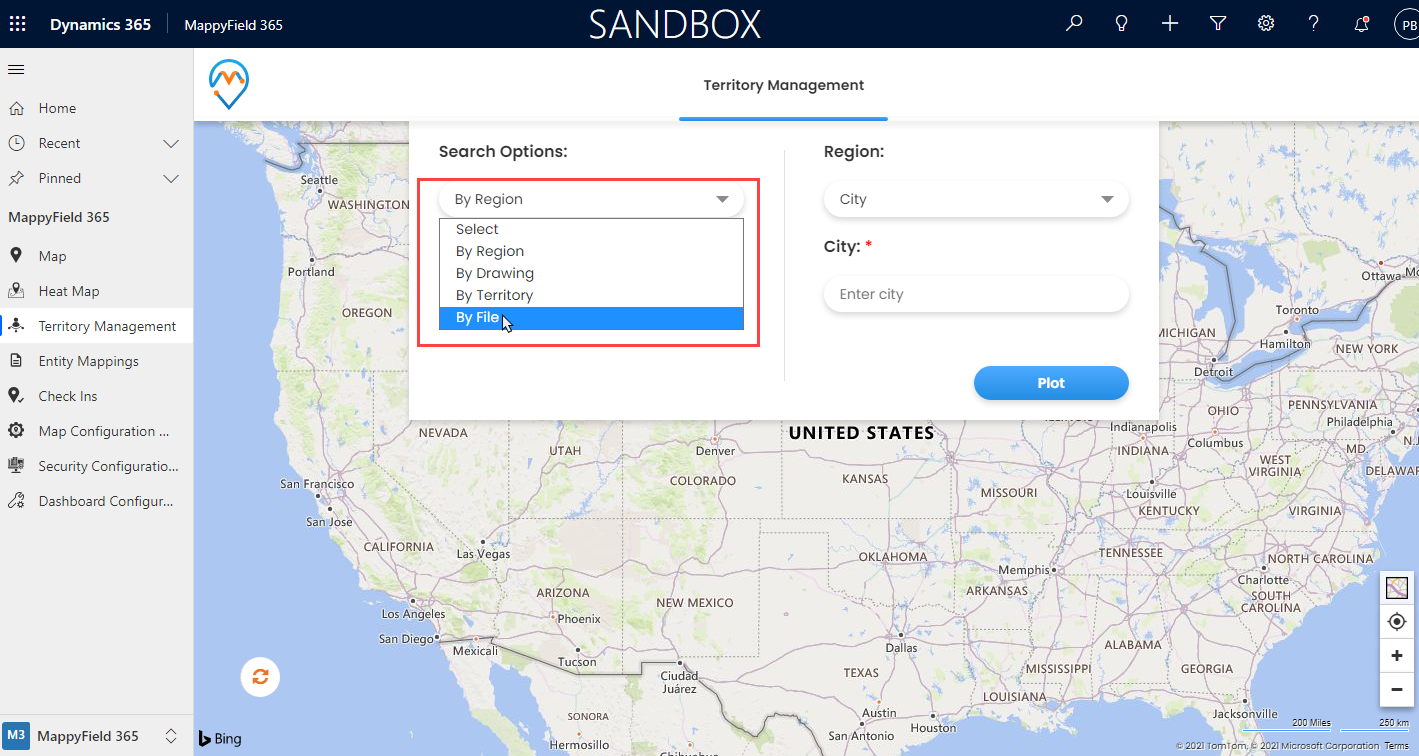
Step 3: Manage Territory By CSV File
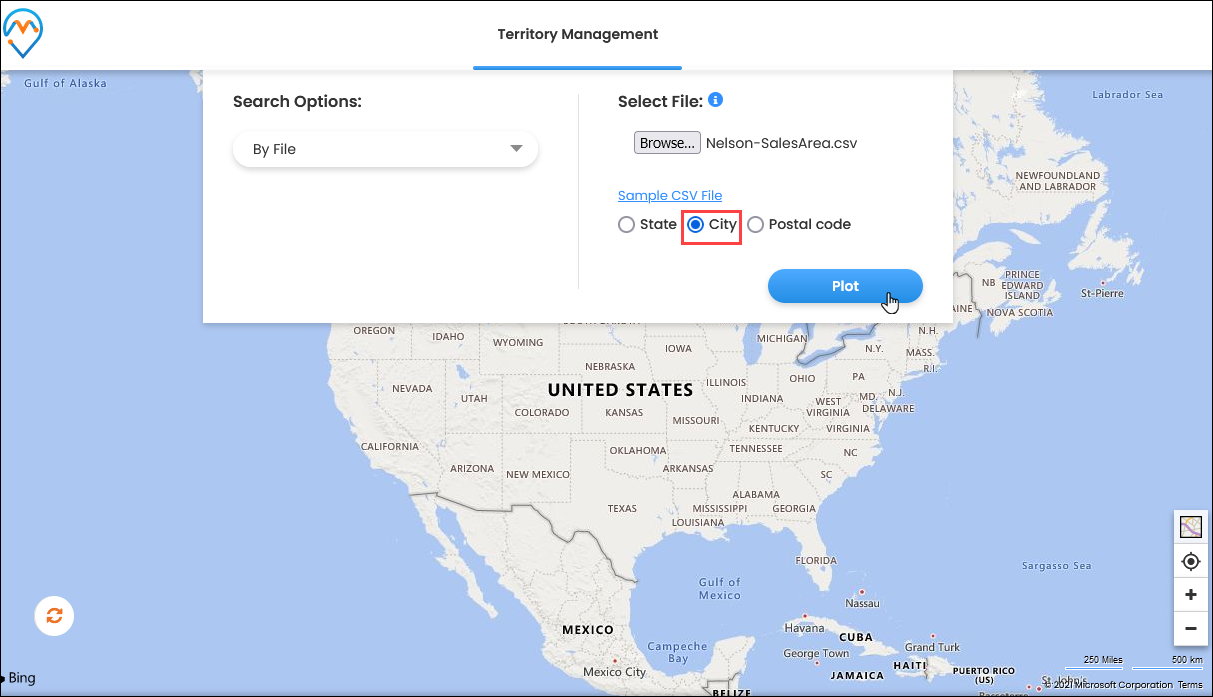
If you have any shapefile to manage the territories, you need to select the “By File” option in Search Options.
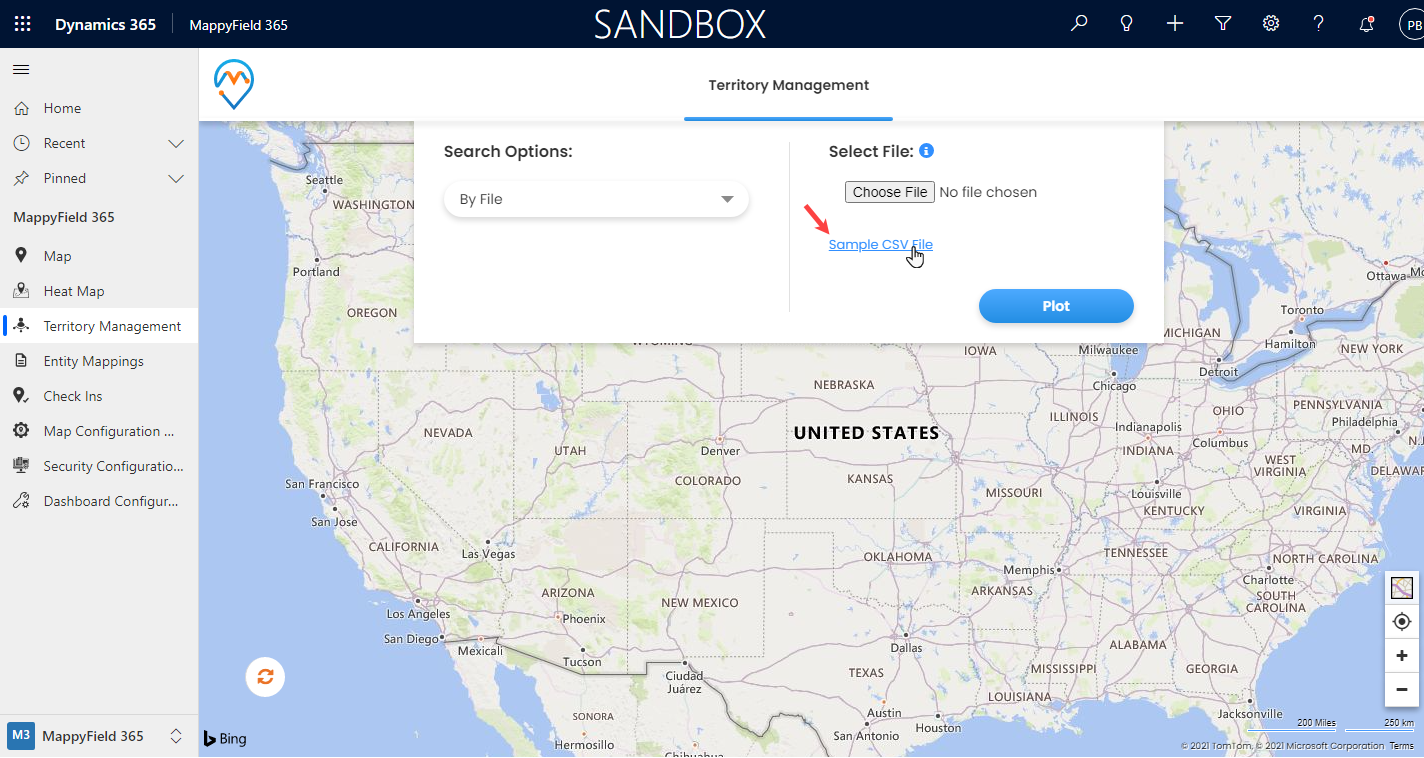
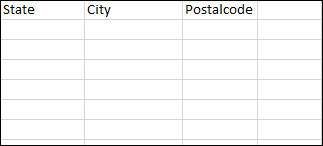
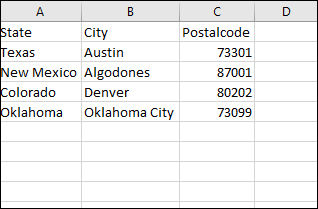
Sample CSV file: You can enter the data manually or if you have another CSV file of the area/region, you need to set the data as per the CSV file format.
After entering data CSV File: After uploading the CSV file, you will see 3 options as “State”, “City”, and “Postal Code”. You need to select the option whichever you want to plot on the map.
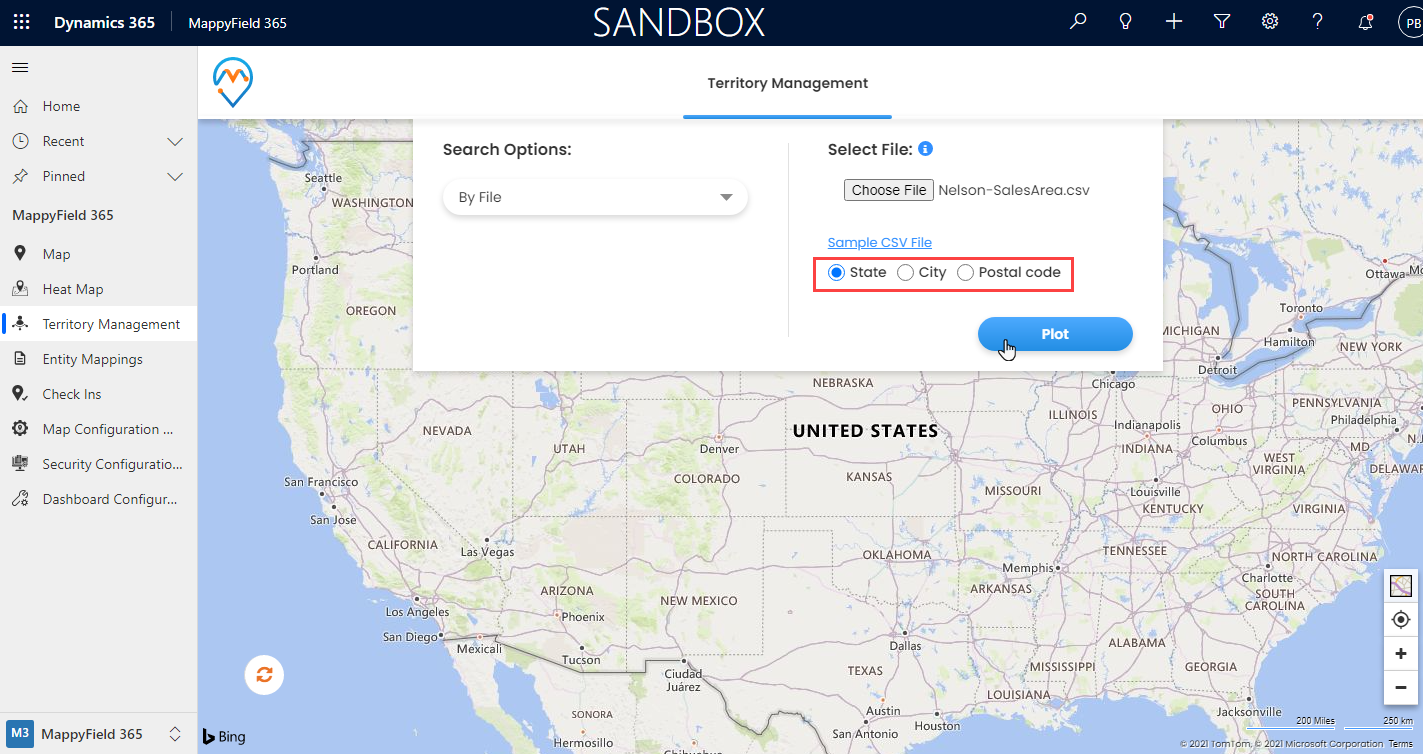
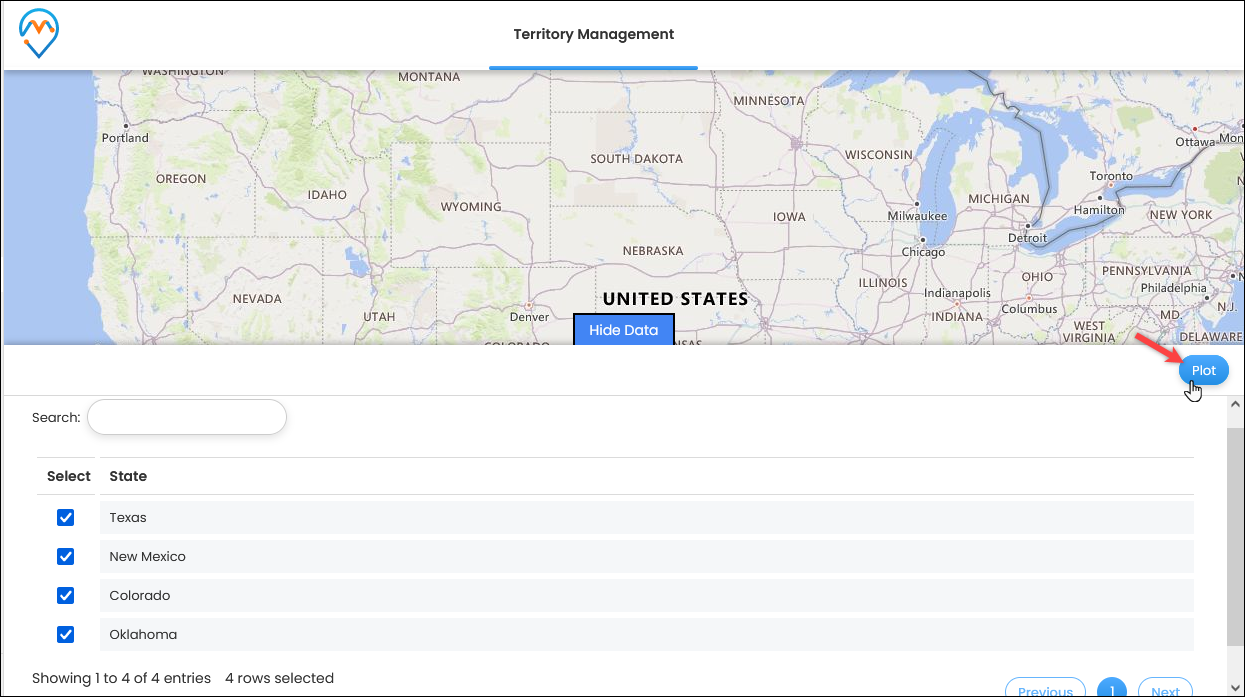
Step 3.1: Select State
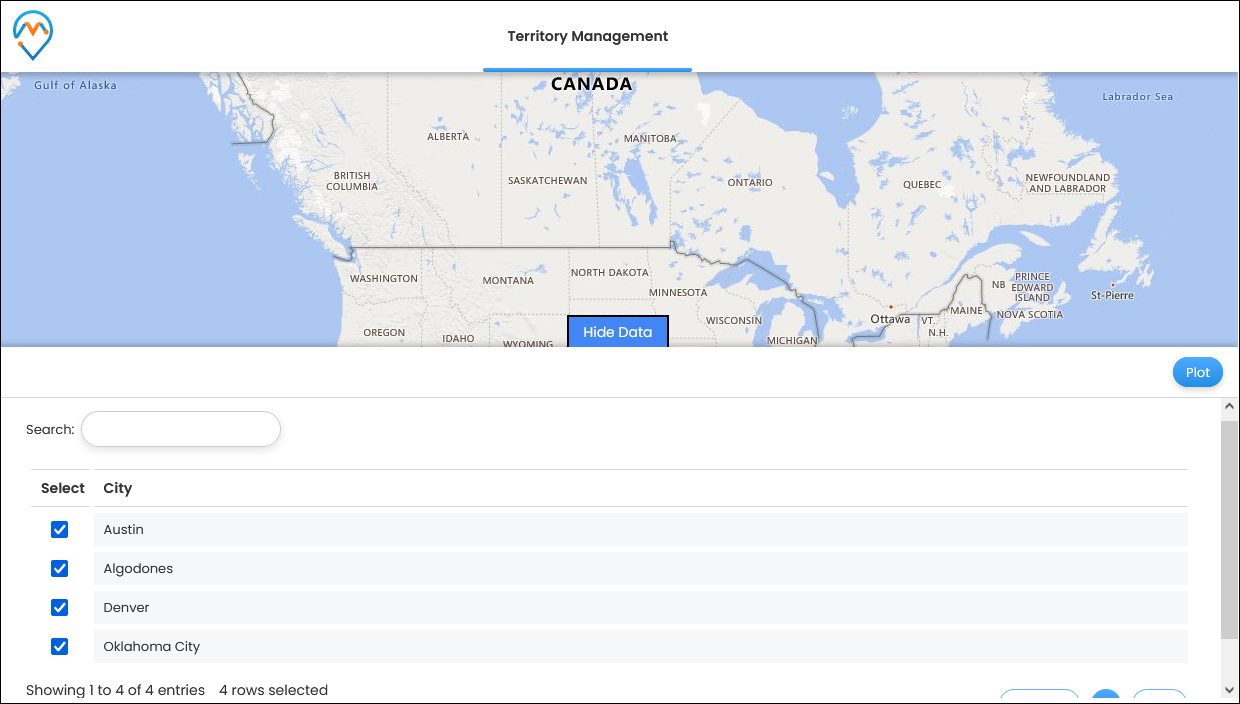
Once you select the “State”, click on the Plot button to add the geographical data on the map. You need to select the imported states from the data grid.
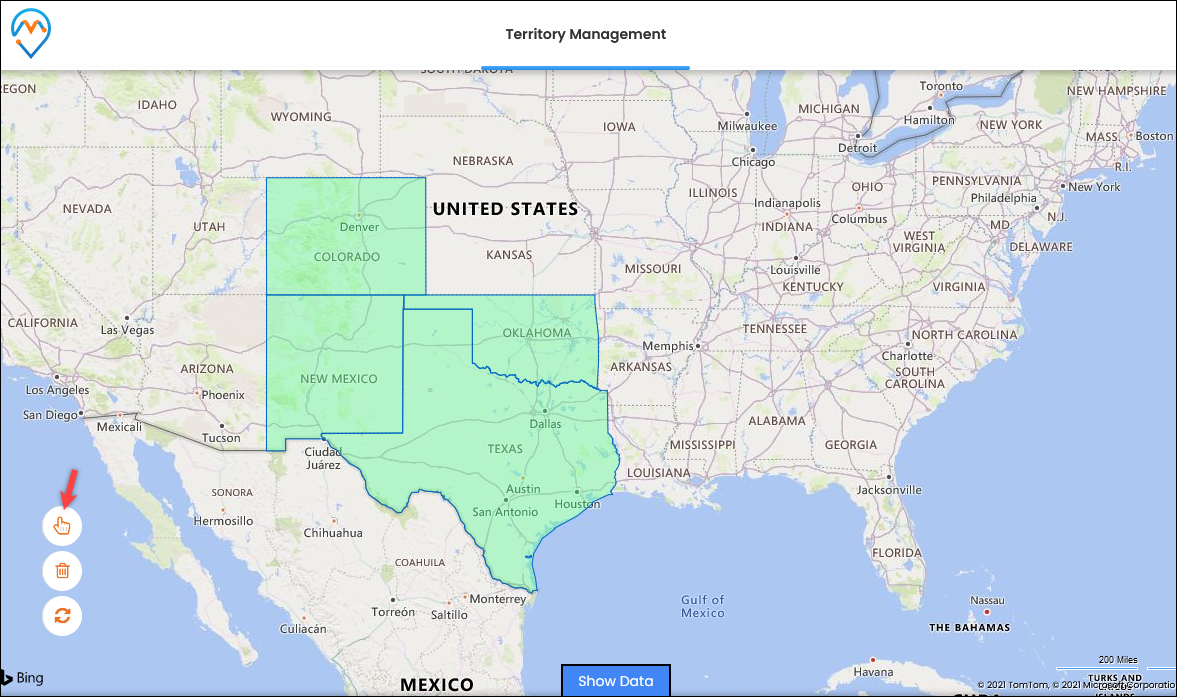
Now, it will plot all the selected states on the map.
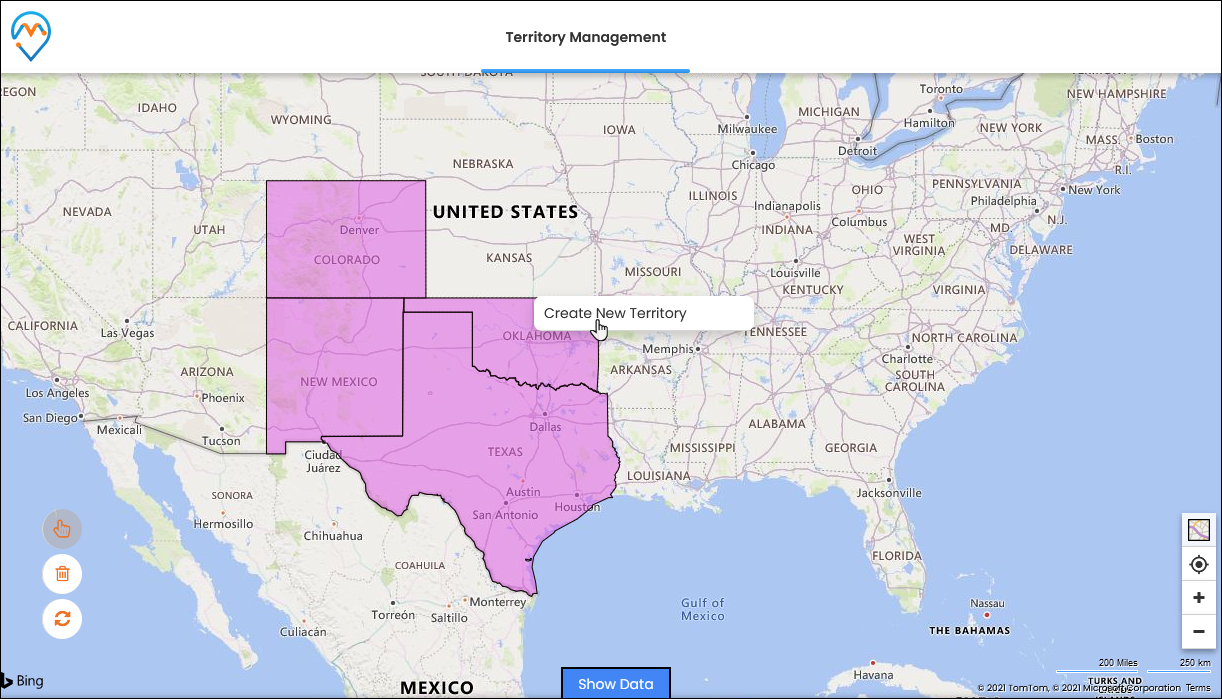
By clicking on the “Create New Territory”, you will get the + Create New Territory popup from where you can create and manage the territory.
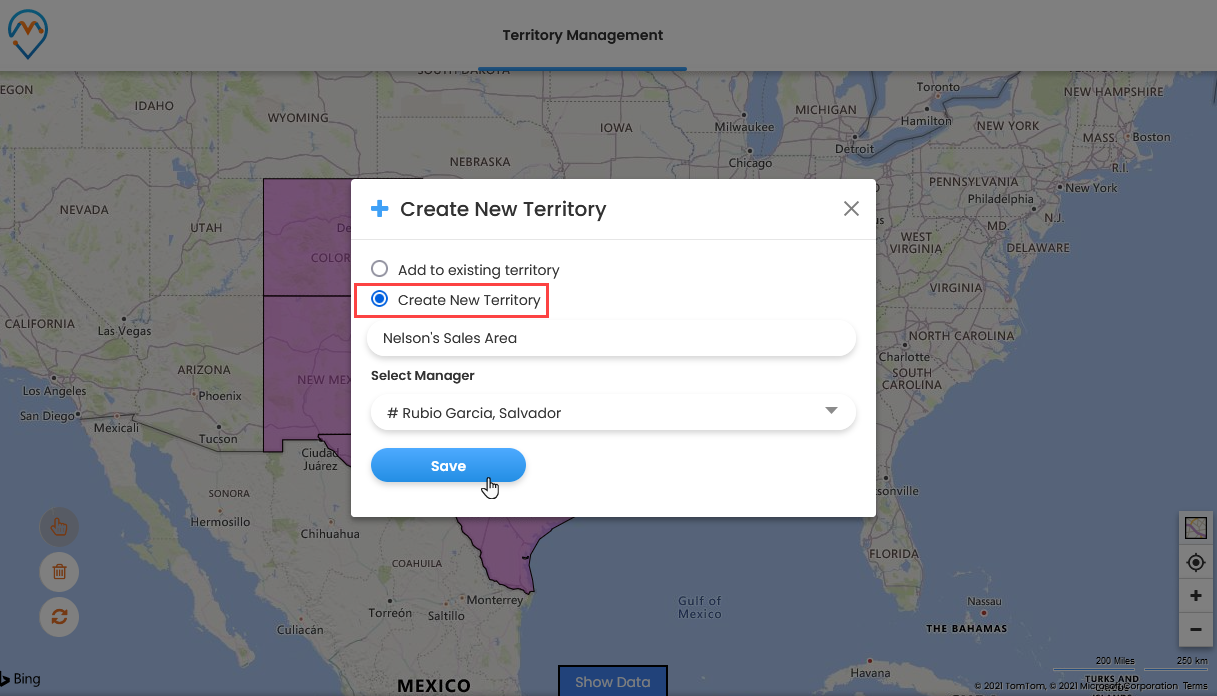
You need to insert the territory’s name and assign the CRM users (Manager) to the territory.
Step 3.2: Select City
Similarly, after uploading the CSV file, you can select the “City” as a region and plot the territory on the map.
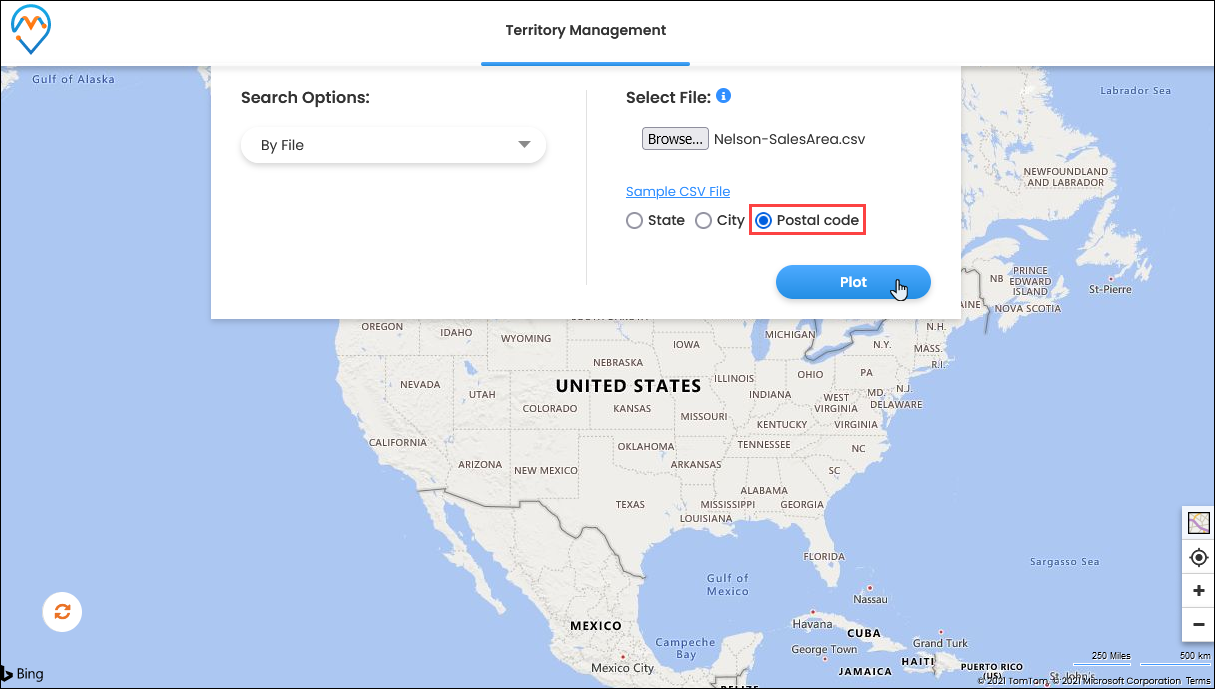
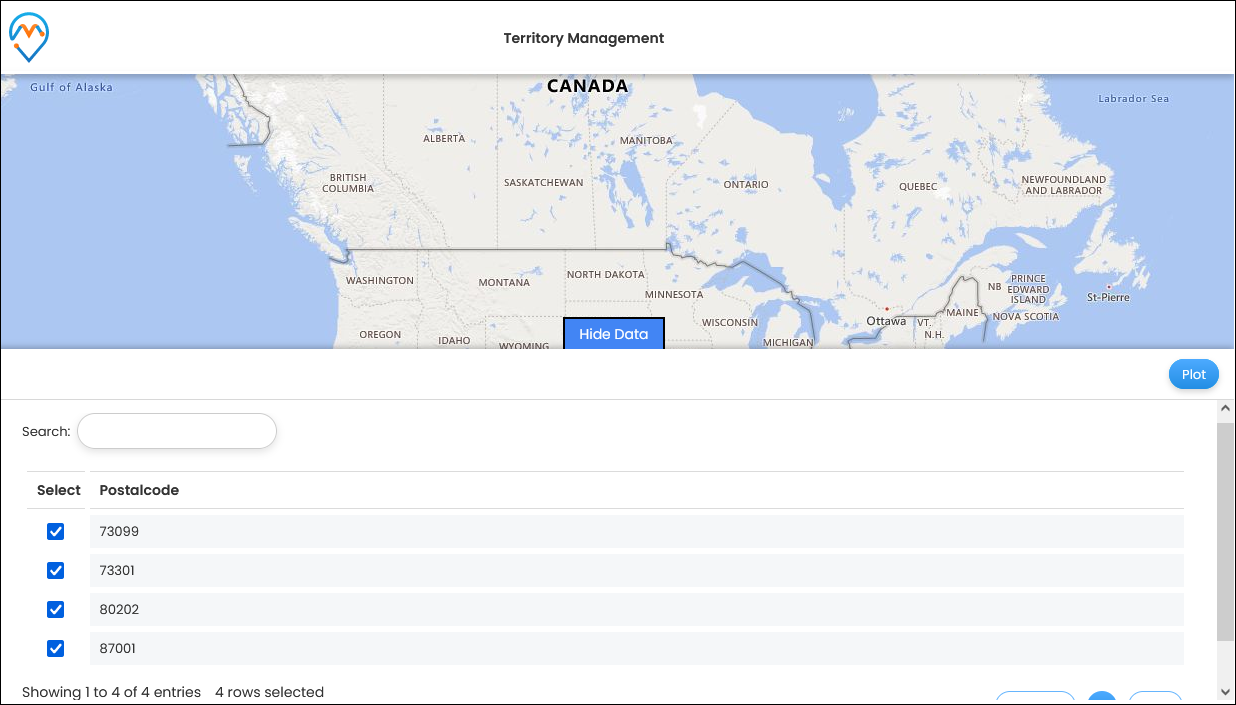
Step 3.3: Select Postal Code
Similarly, after uploading the CSV file, you can select the “Postal Code” for a region and plot the territory on the map.
AppJetty MappyField 365, is a geo-analytical plugin for “Microsoft Dynamics 365”, you can plot the Dynamics 365 records on the map. You can manage the teams and the CRM records on the map itself by using many user-friendly and advanced features of MappyField 365.
If you want to know about any feature regarding AppJetty MappyFIeld 365, feel free to reach out to us at [email protected] or you can just click on the “Request Demo”.
All product and company names are trademarks™, registered® or copyright© trademarks of their respective holders. Use of them does not imply any affiliation with or endorsement by them.


