Maps are an excellent way to view CRM data and can drastically change how sales teams approach their work.
It is considerably easier to analyze a set of sales data and understand in which regions they are high and in which they can be increased rather than wade through tons of reports.
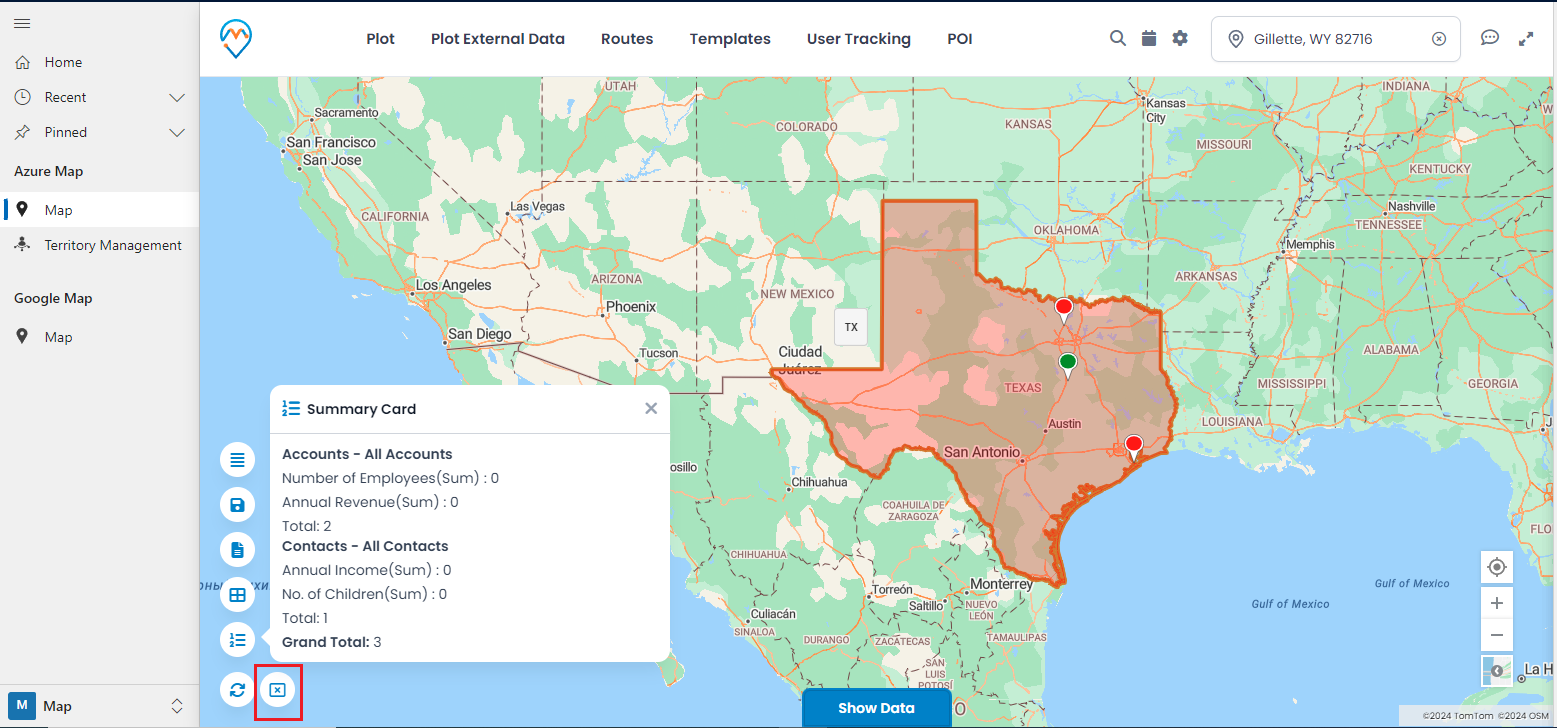
Data separation by geographical regions is quite beneficial, especially for managers who wish to monitor their teams’ progress and outcomes.
In Dynamics CRM, the data is linked with maps to give an overall view of the region to enhance activities. This approach allows for more efficiency and cost savings, but it also assists in becoming more rational.
Before you know it, you see which sectors require more focus and which team sections perform well. Now let me explain how you can design and set up region-wise CRM data visualization in Dynamics CRM and leverage the potential of your Sales data.
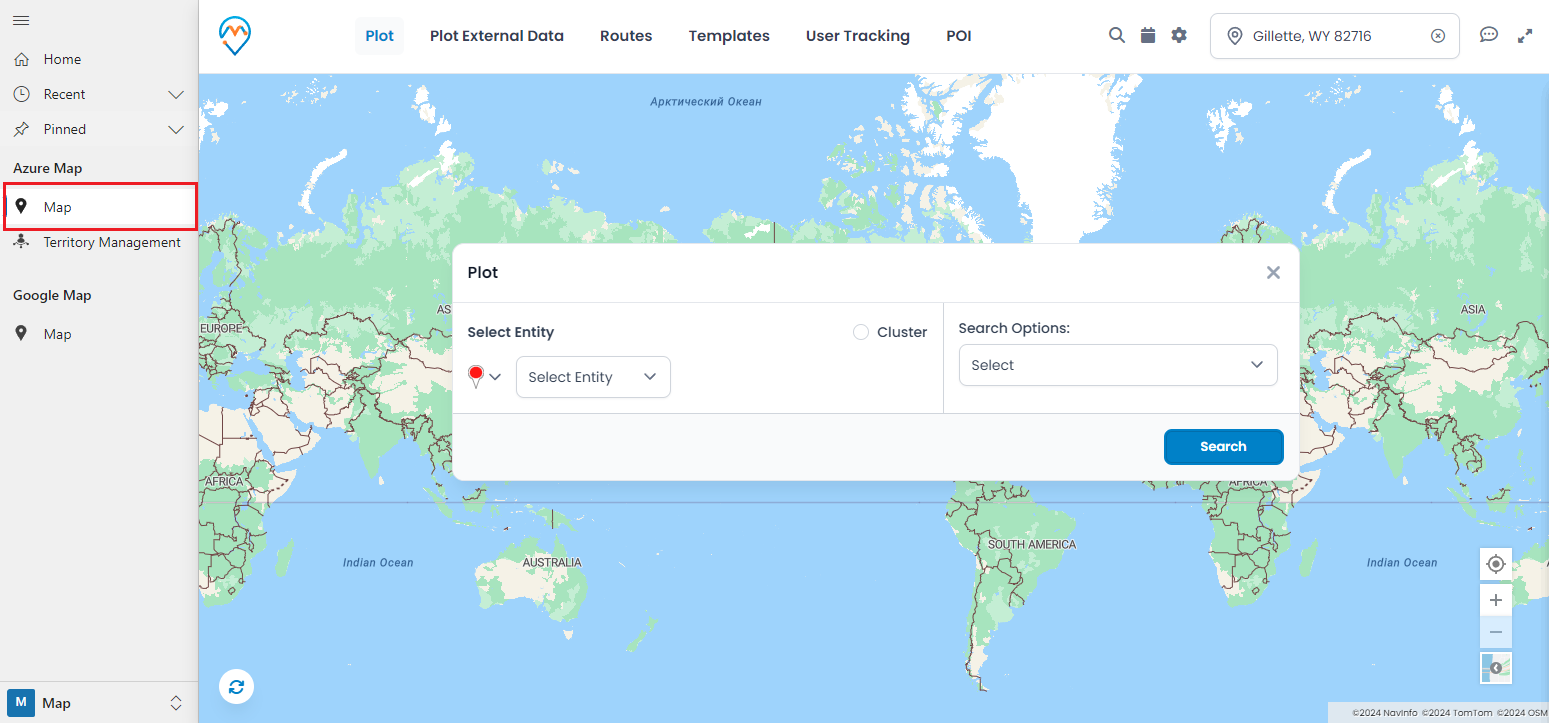
Step 1: Redirect to the “Map” page
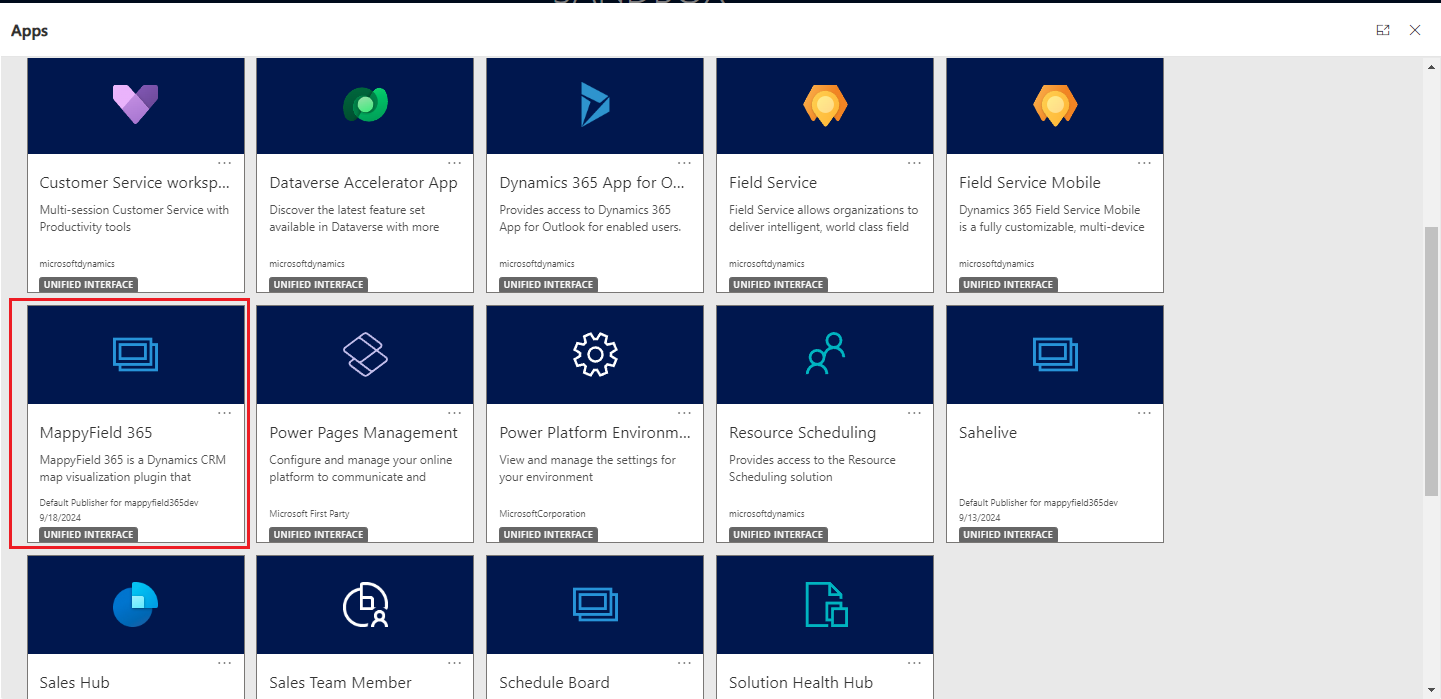
Once logged into Dynamics 365, select “MappyField 365” from the apps dashboard.
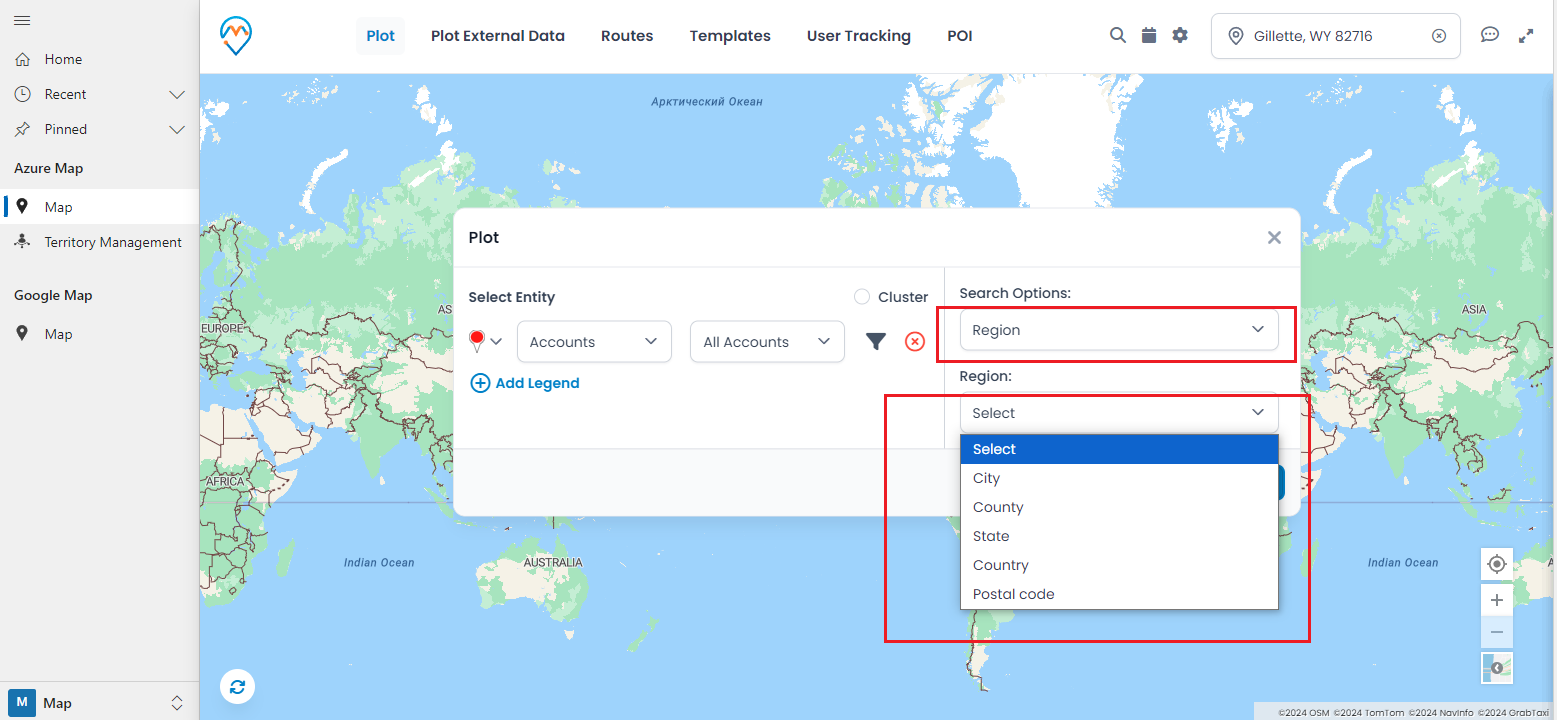
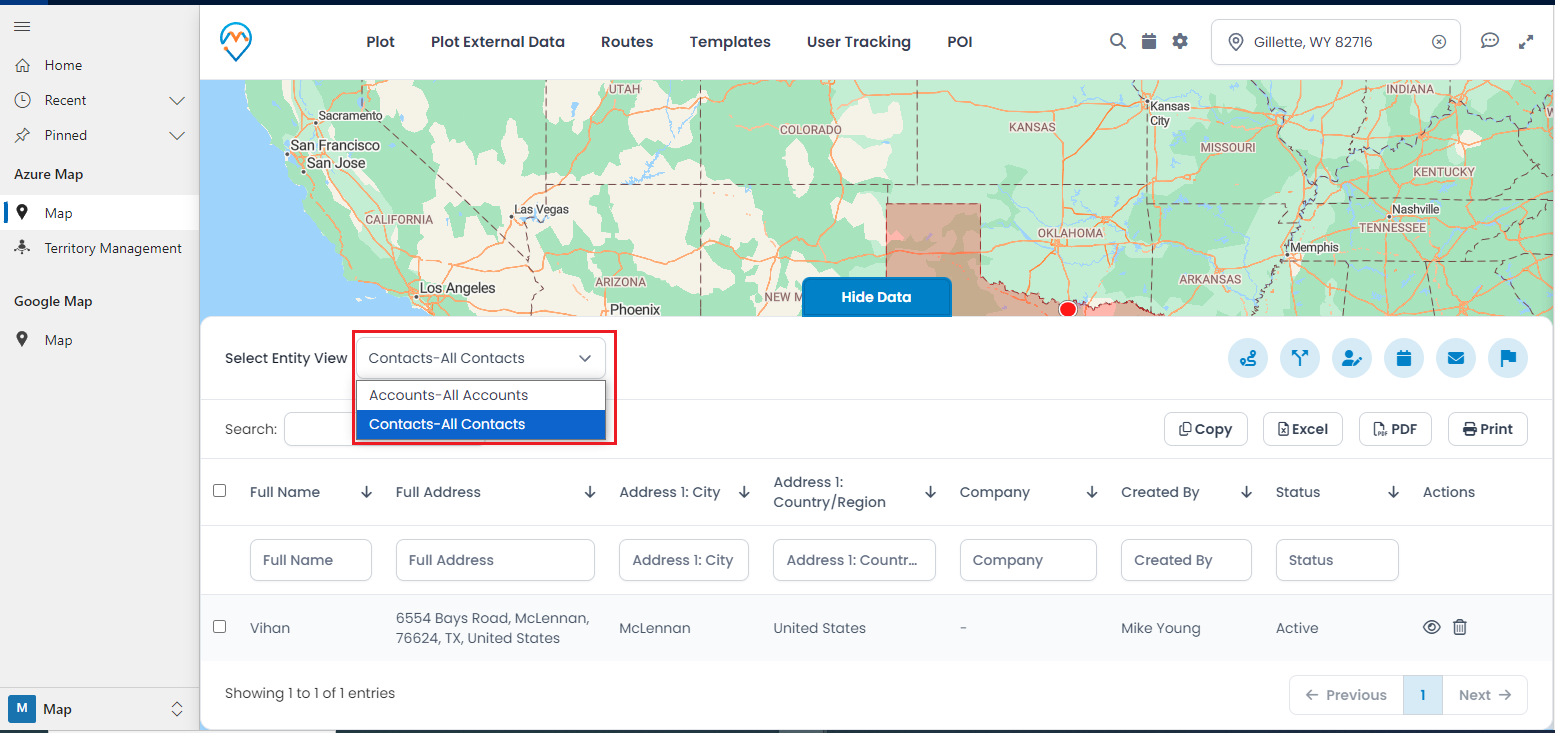
– In the “Search Options” dropdown, choose “Region.”
– Then, select the desired region type from the “Region” dropdown. Options include City, State, Country, and Postal Code.