

Sometimes it can be challenging to search for specific records in particular regions, especially when the data is scattered within the same fields. In such scenarios, drawing shapes can be highly beneficial. The MappyField MS Maps tool provides options to plot and filter data by allowing users to draw different shapes such as polygons, circles, or rectangles to plot data within the boundaries of the shapes.
Microsoft Mapping Tools, such as MappyField 365, also enable users to display a shape’s size and dimensions. Here’s how to view the measurements of drawn shapes:
1. Go to the Map tab.
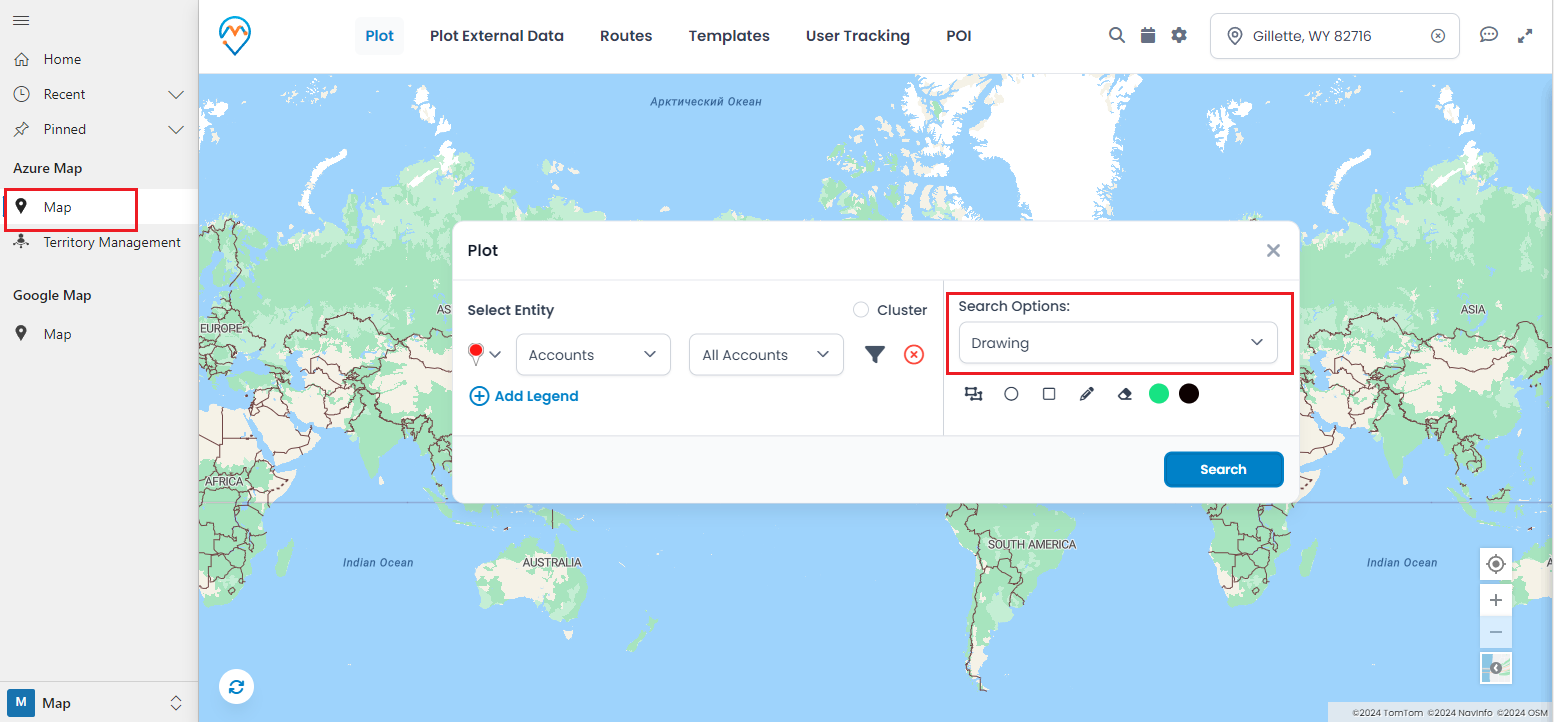
2. Select the Plot tab from the top navigation to access the drawing tool.
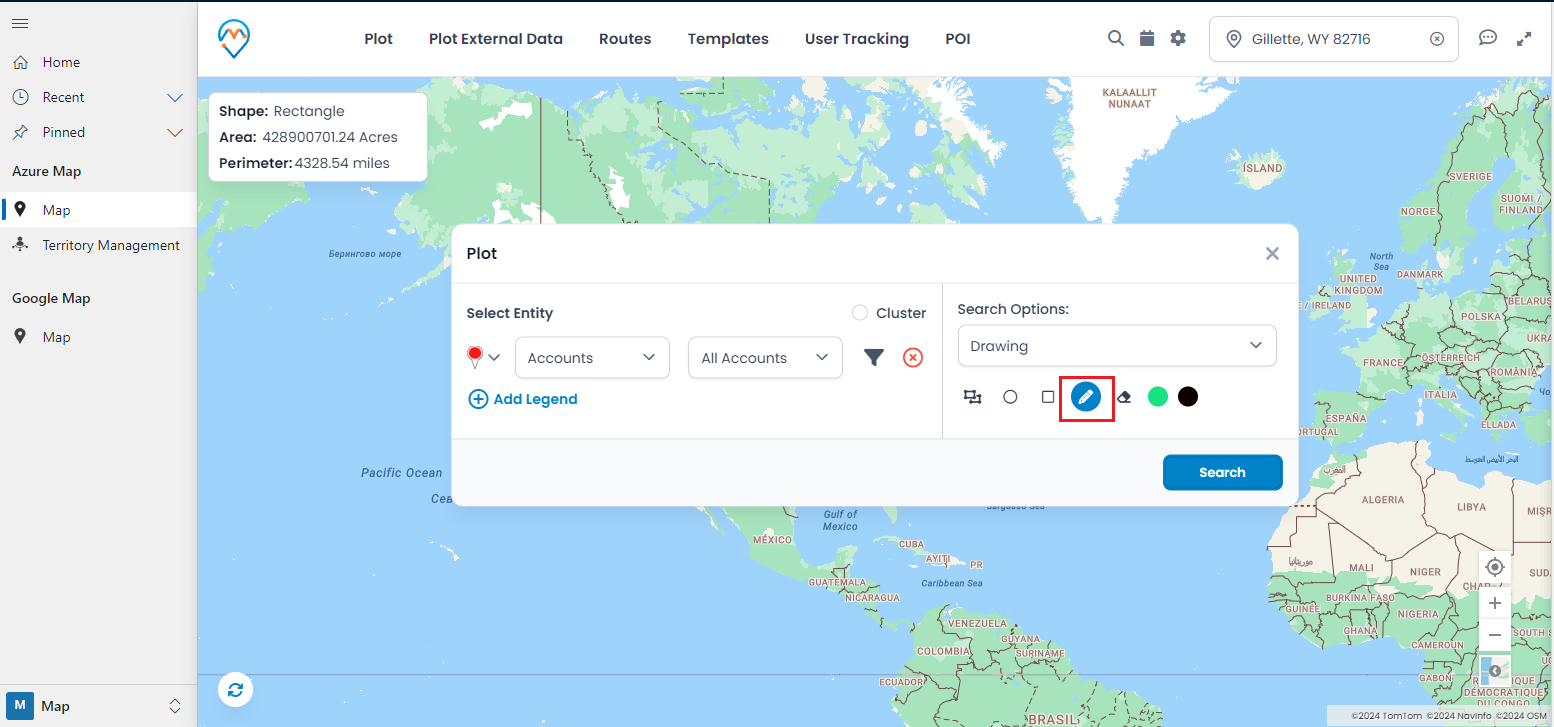
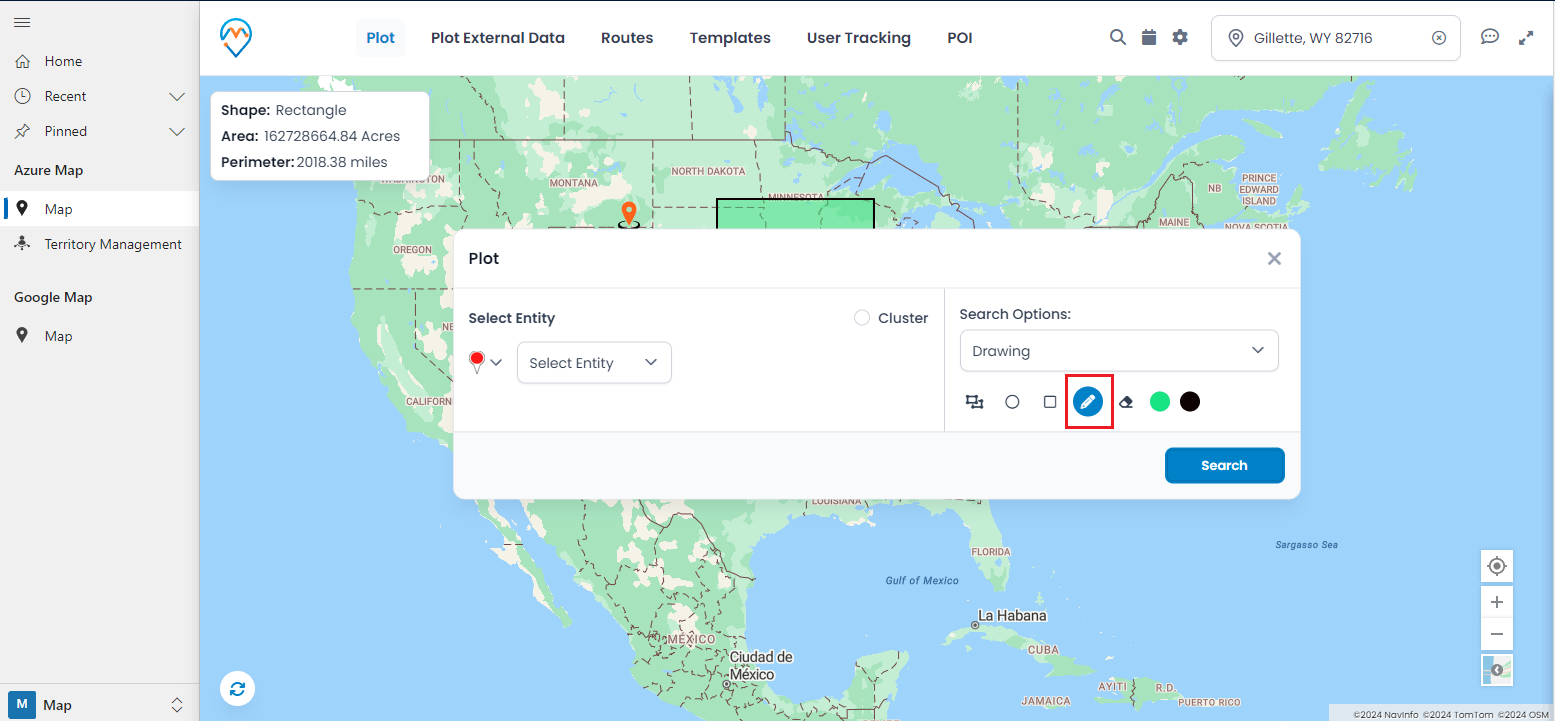
3. From the Search Options dropdown, select the Drawing option.
Draw Polygon
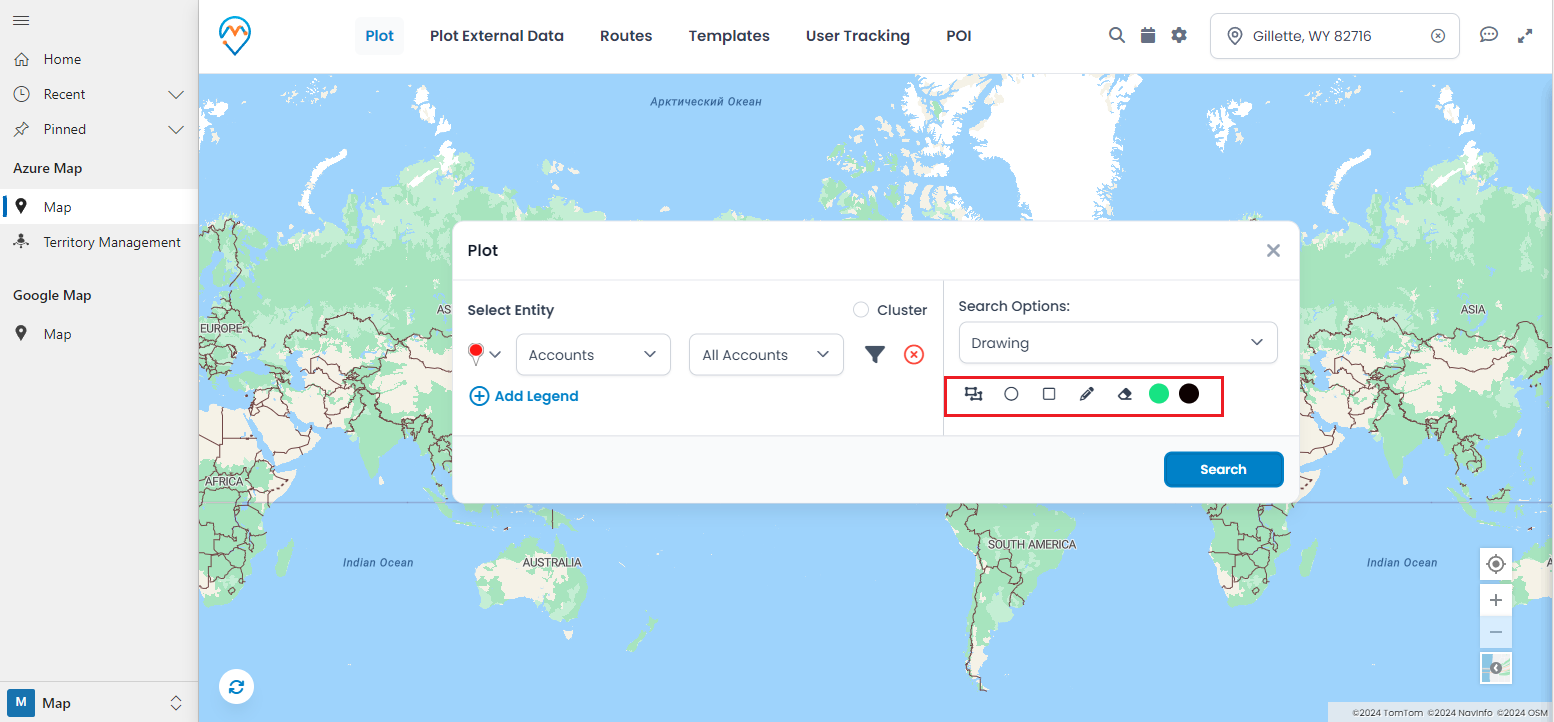
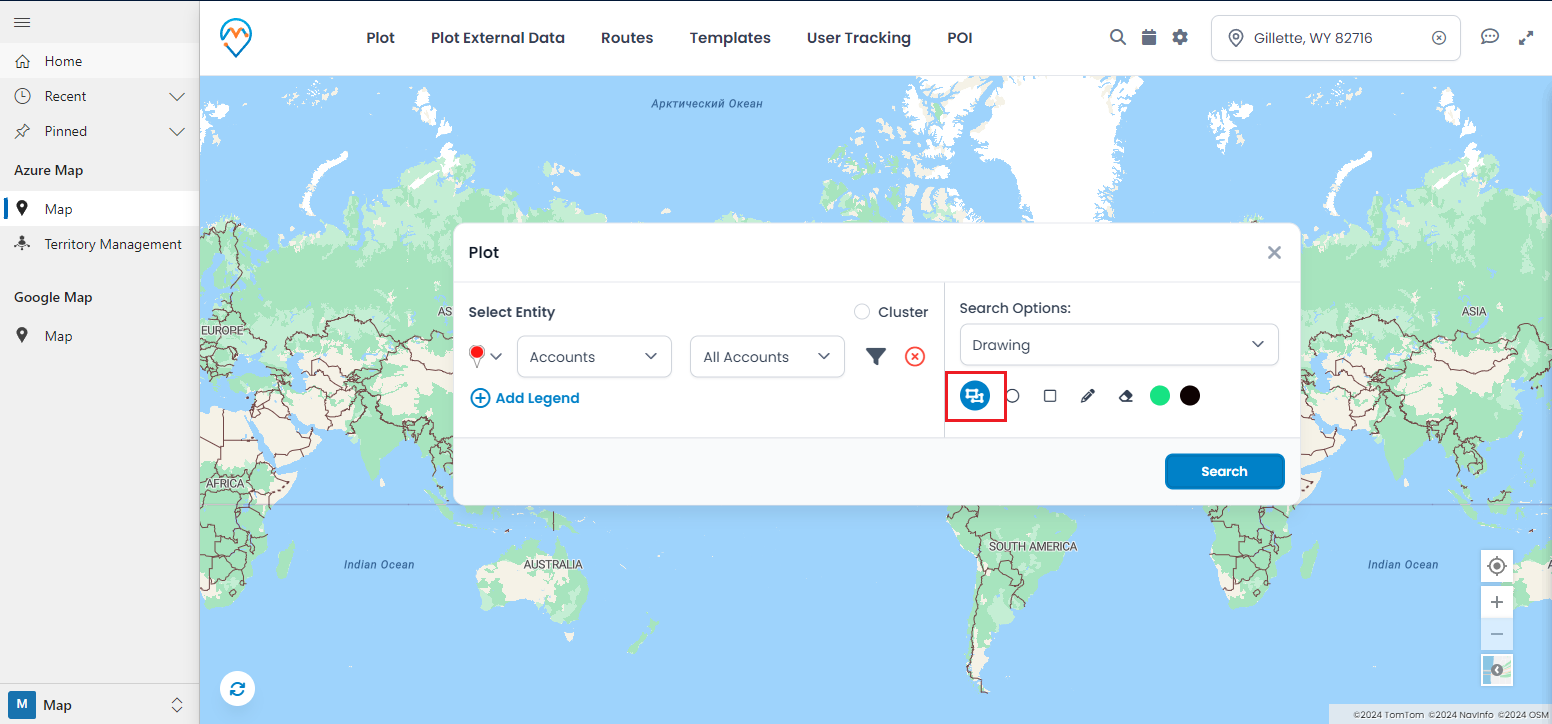
Step 1: Select the polygon drawing shape from the drawing tool options.
Step 3: While drawing, the measurements of the polygon, such as its area and perimeter, will be displayed.
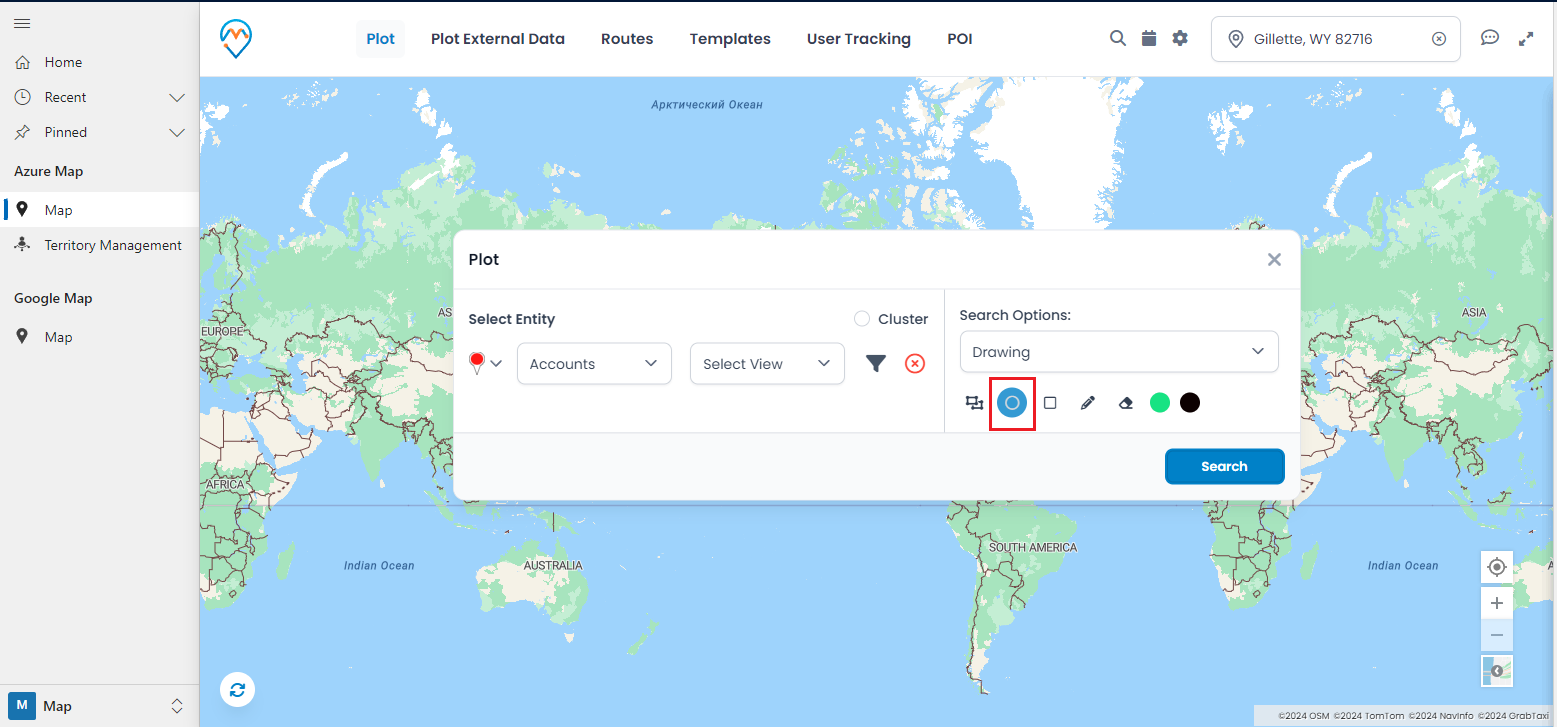
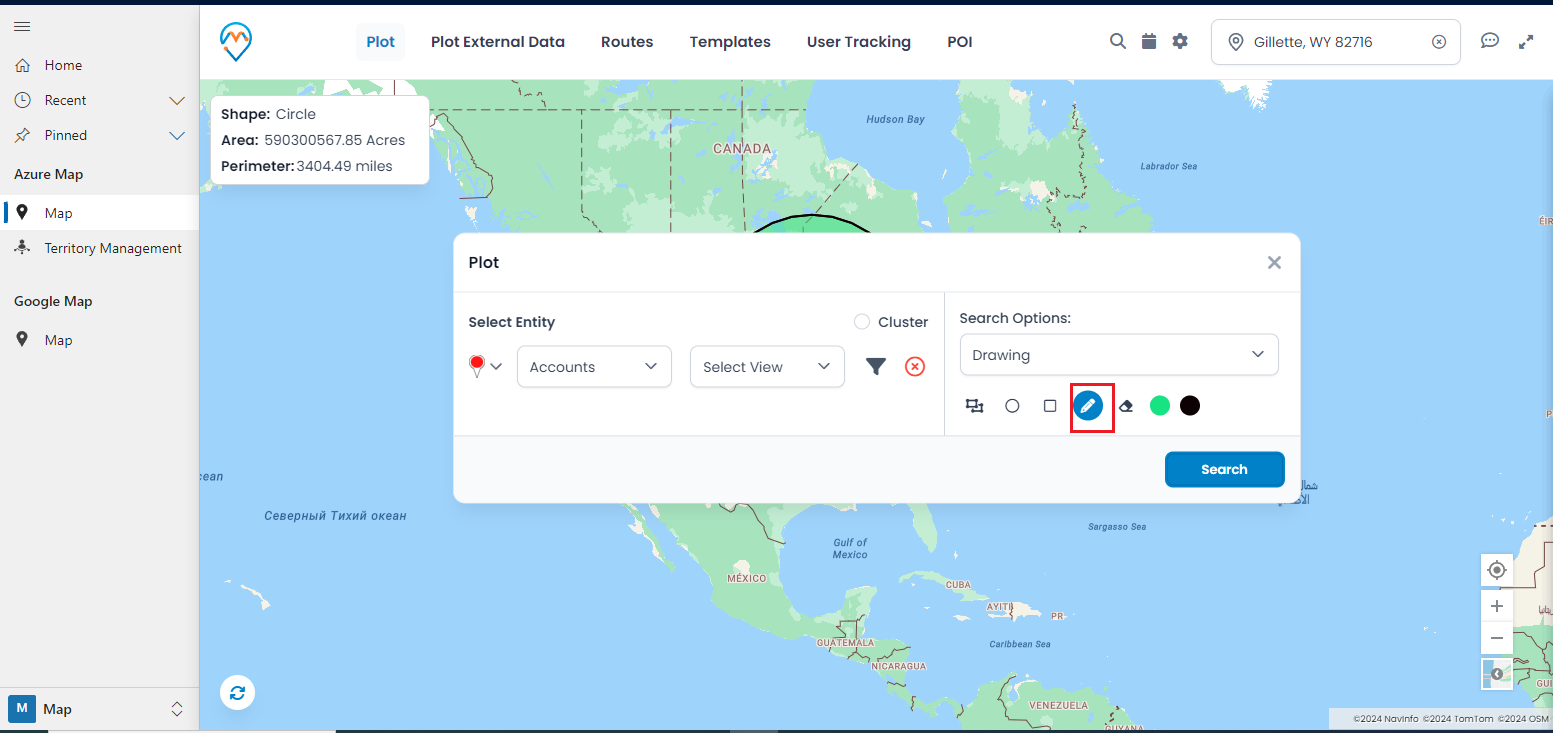
Step 1: Select the circle shape from the drawing tool options.
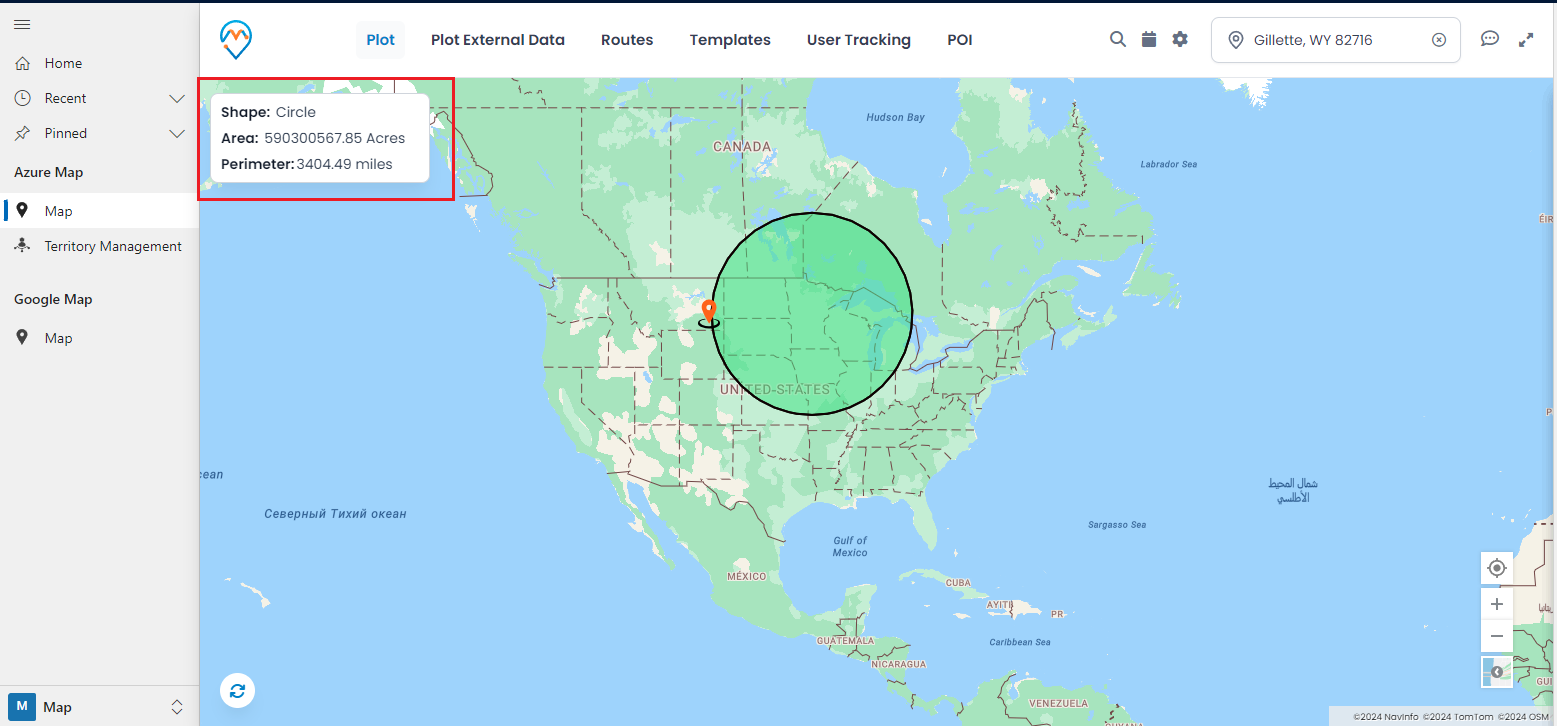
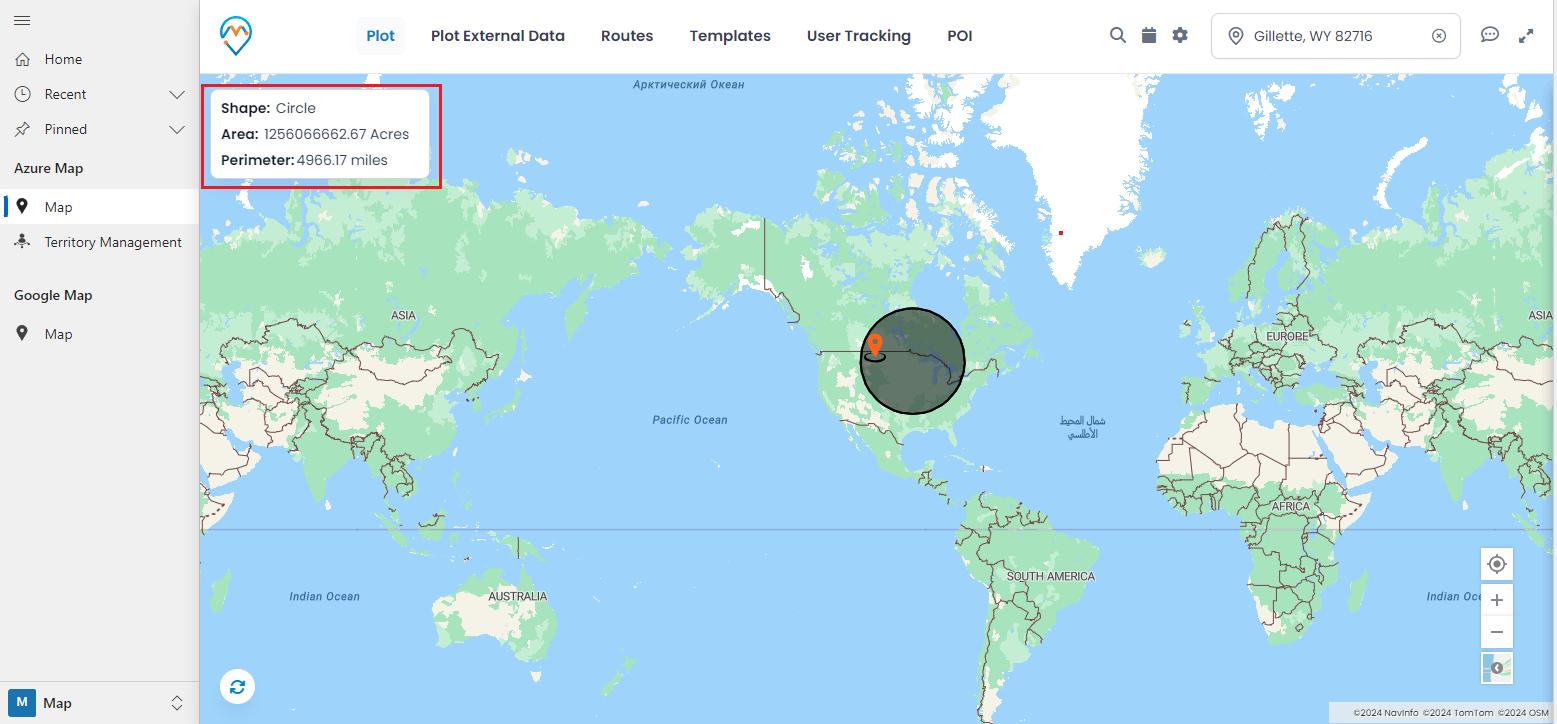
Step 3: While drawing the circle, the measurement details will be displayed. You can view the area and perimeter of the circle.
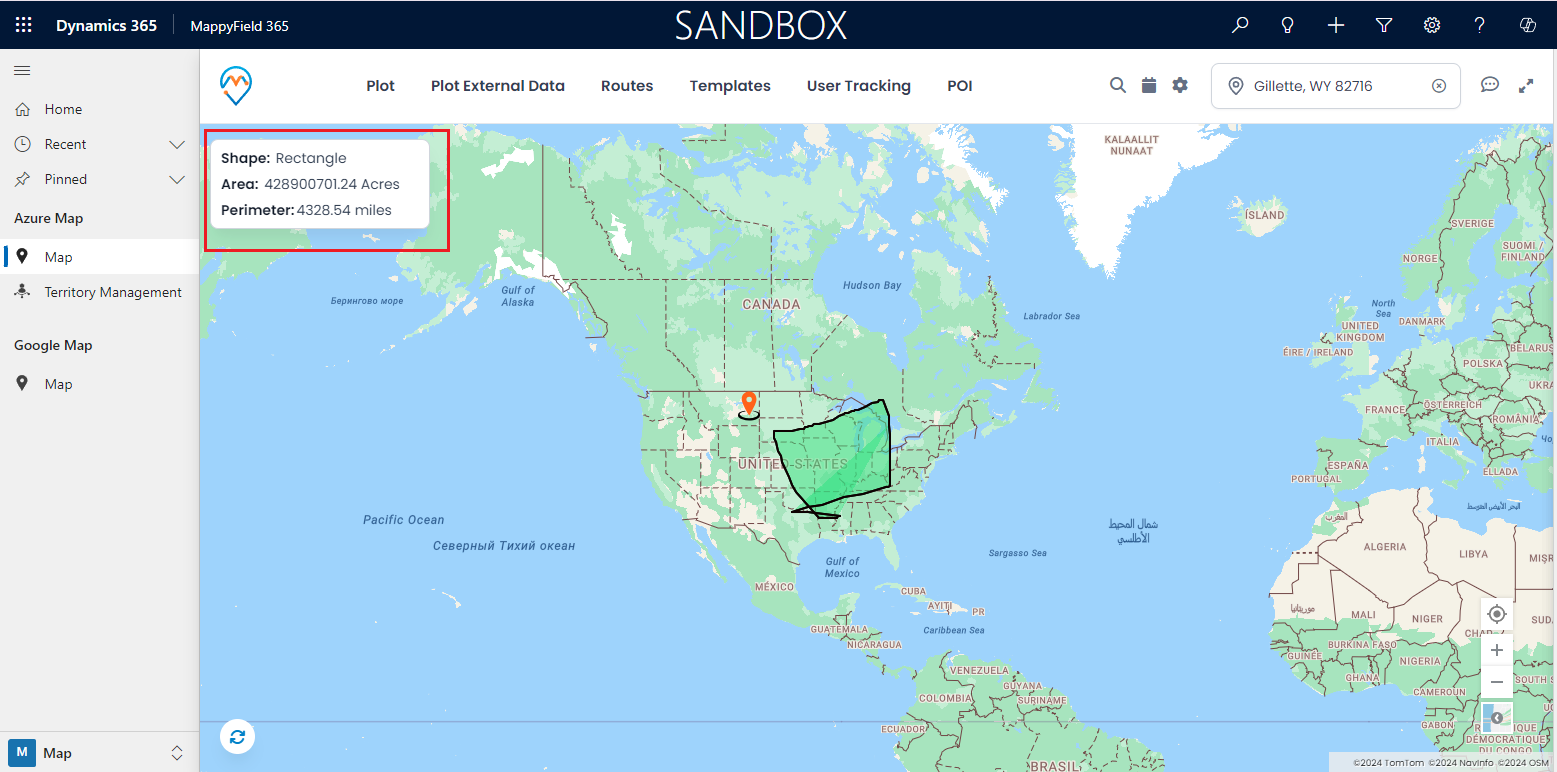
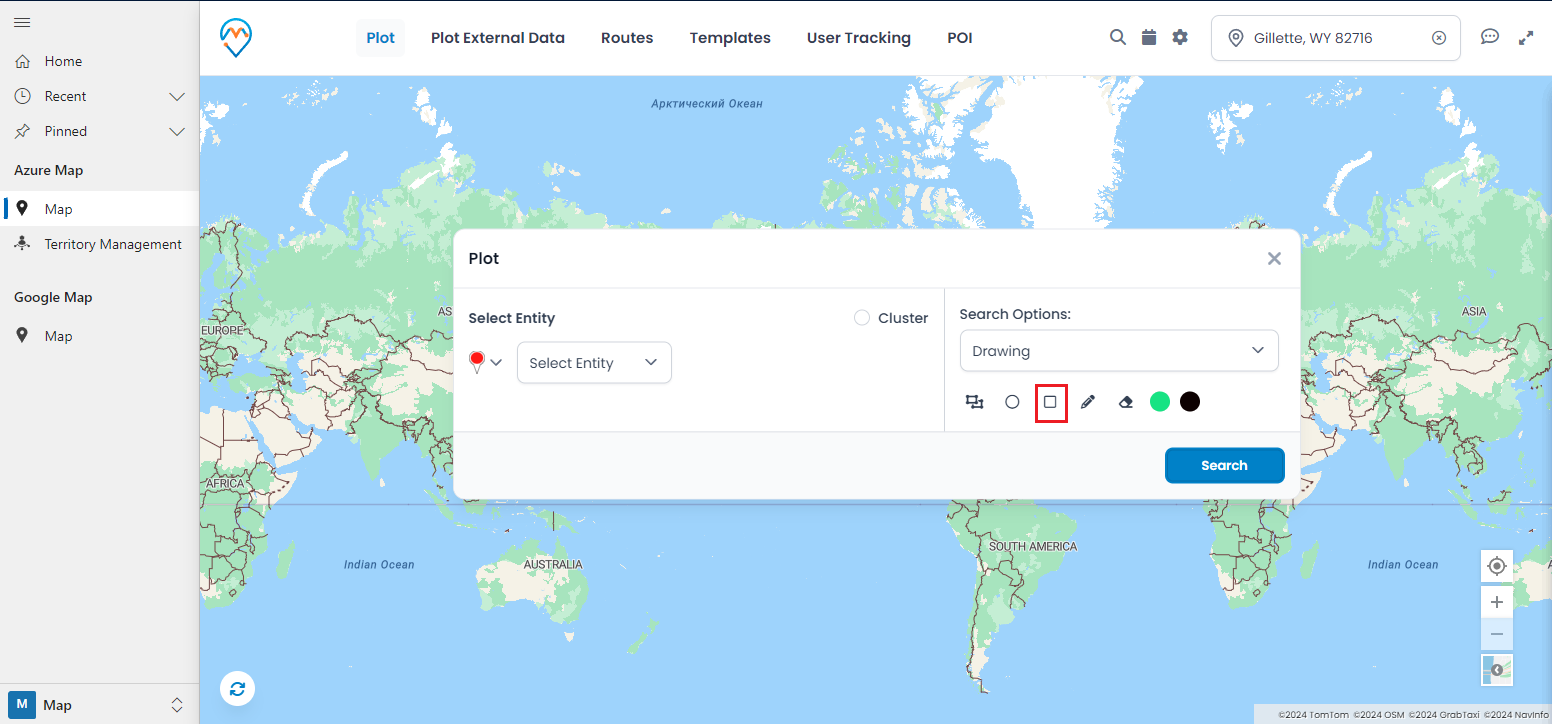
Step 1: Select the rectangle shape from the drawing tool options.
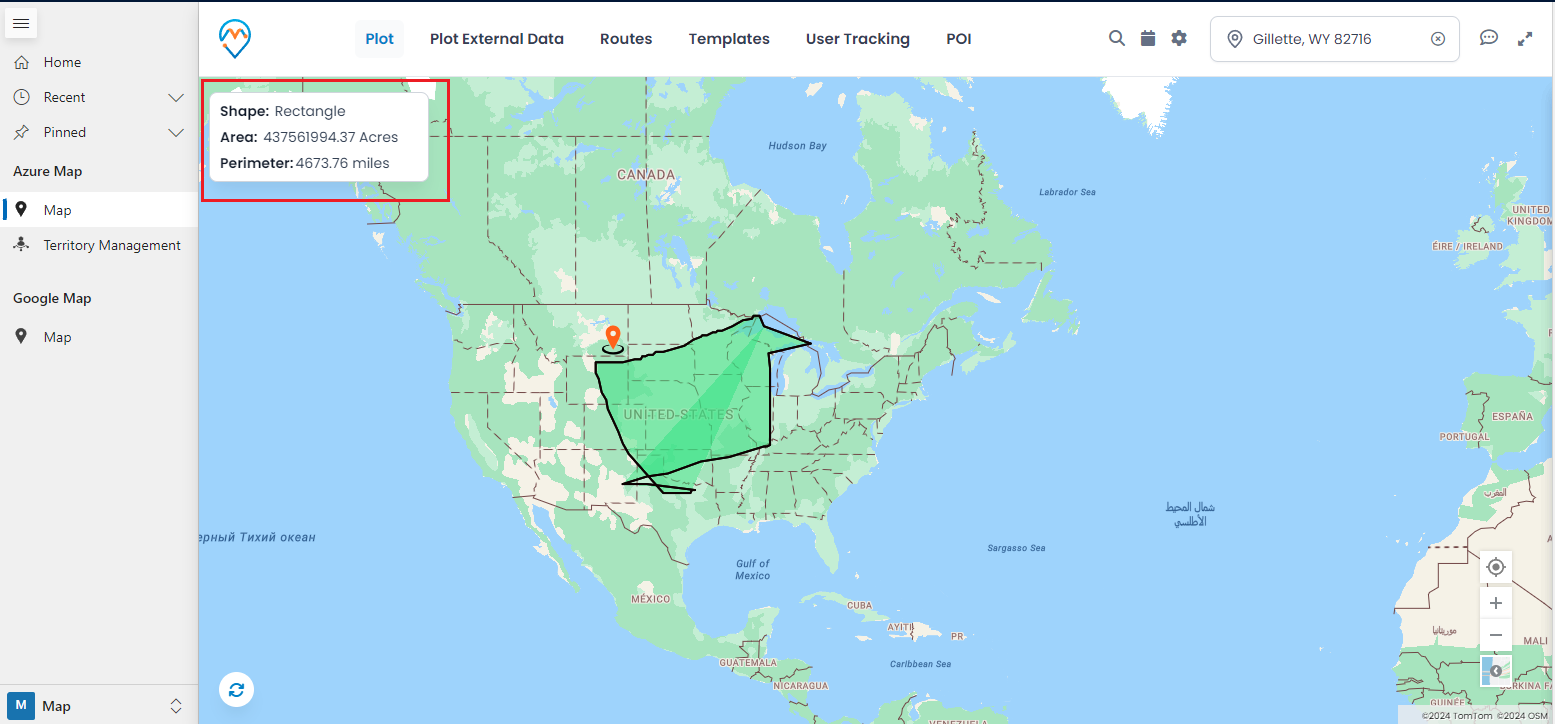
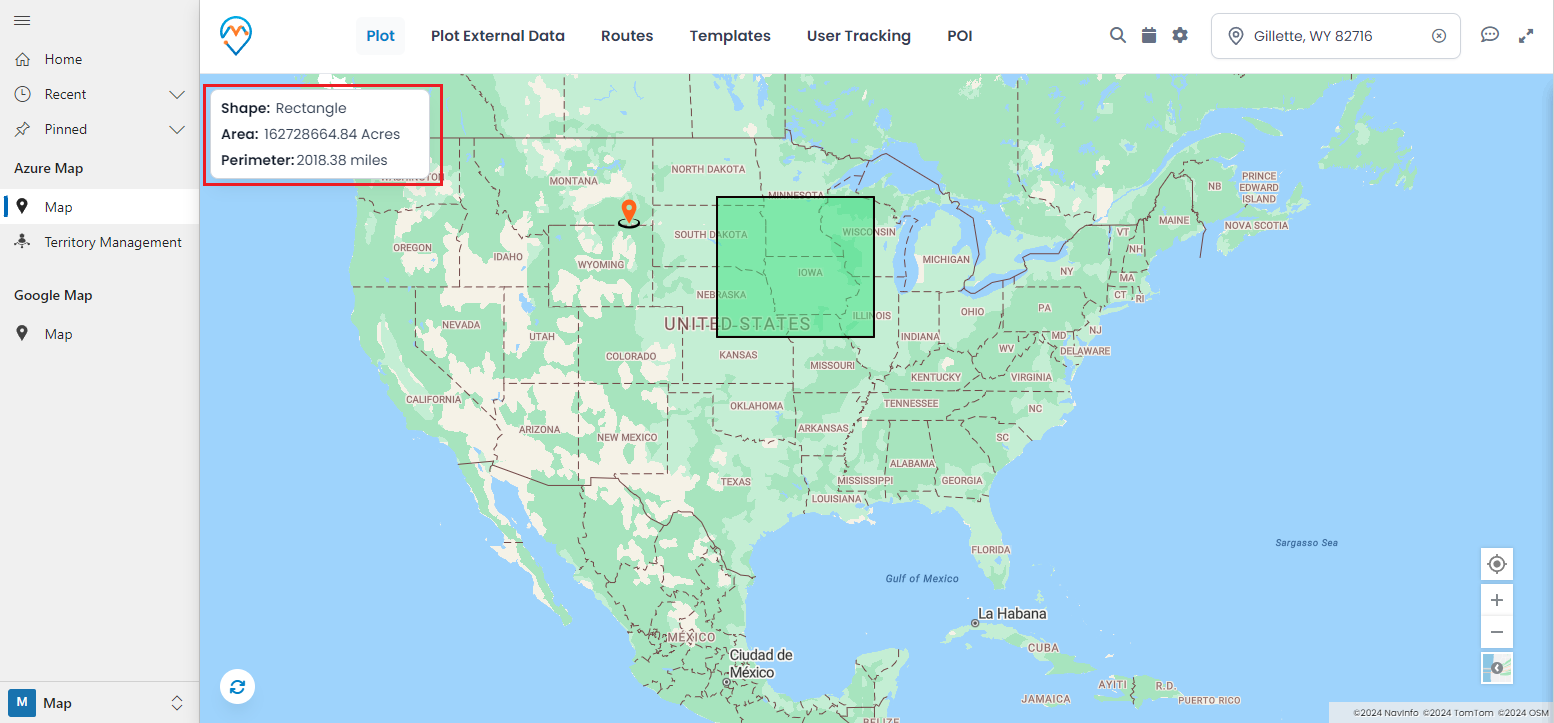
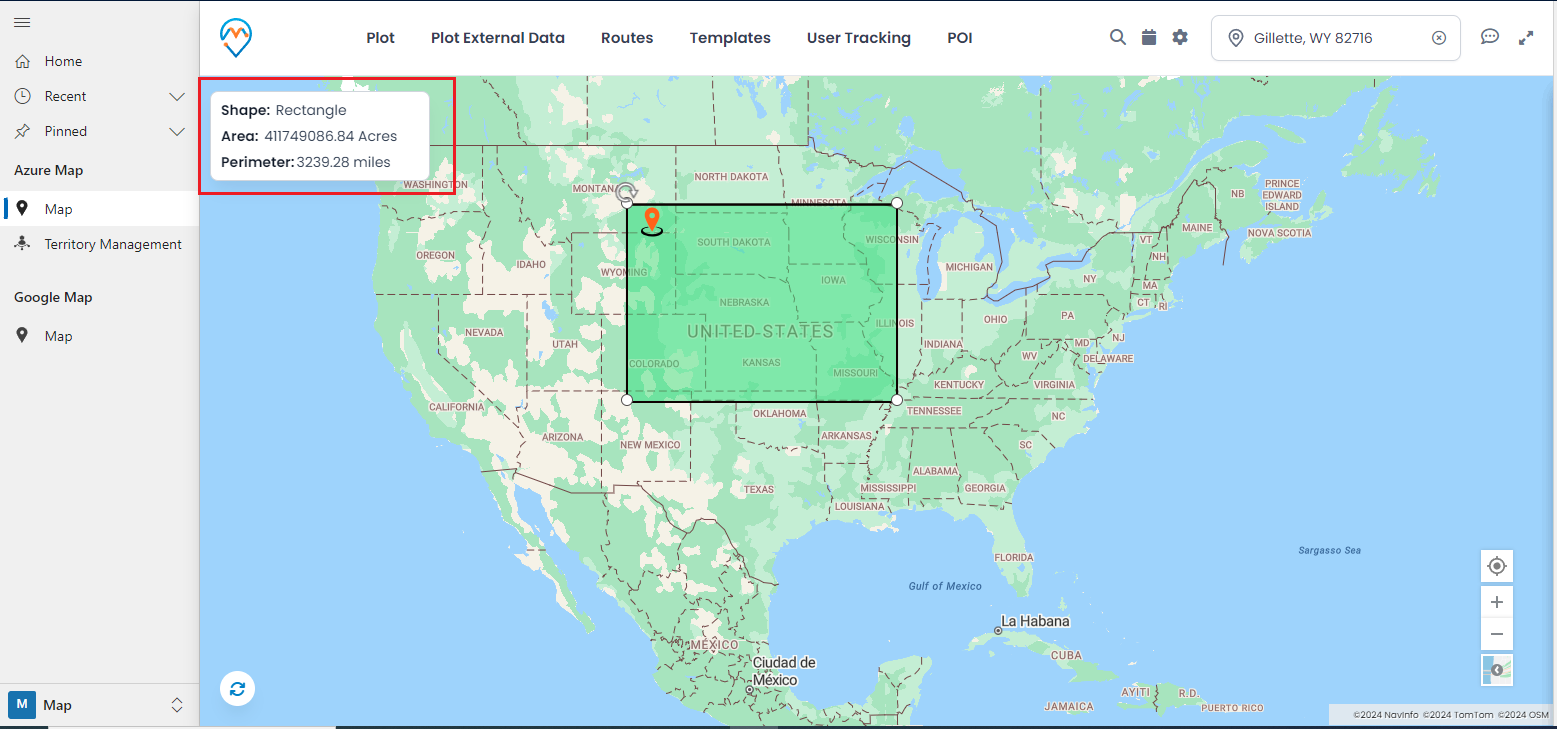
Step 3: While drawing, you can view measurements such as the rectangle’s area and perimeter.
All product and company names are trademarks™, registered® or copyright© trademarks of their respective holders. Use of them does not imply any affiliation with or endorsement by them.


